Office 552, Engineering and Computer Science (ECS) building
University of Victoria
Victoria, British Columbia, Canada
cperin@uvic.ca(+1) 250 472 5783

About Me
I am an Assistant Professor of Computer Science at the University of Victoria, where I lead the UViz research group (awesome website to appear soon) specializing in information visualization and human computer interaction.
At UViz we conduct research on designing and studying new interactions for visualizations and on understanding how people may make use of and interact with visualizations in their everyday lives. We are particularly interested in designing visualization tools for authoring personal visualizations and for exploring and communicating open data; in sports visualization; and in visualization beyond the desktop.
Before joining UVic, I was a Lecturer (eq. Assistant Professor) in the Department of Computer Science at City, University of London, and part of the giCentre research group. Before joining City, I was a Post-doc in the Department of Computer Science at the University of Calgary, InnoVis, with Sheelagh Carpendale. I obtained my PhD on Direct Manipulation for Information Visualization, at Université Paris Sud-XI in 2014, under the supervision of Jean-Daniel Fekete in the INRIA team AVIZ and Frédéric Vernier in the LIMSI-CNRS team AMI.
News
-
Oct. 2019
Congrats to Johnnes Liem for successfully defending his PhD thesis and for presenting (virtually) our Eurovis paper 'Structure and Empathy in Visual Data Storytelling: Evaluating their Influence on Attitude'. Congrats also to Fatemeh Rajabiyazdi who presented (virtually) our GI paper 'Exploring the Design of Patient-Generated Data Visualizations', to Bon Adriel Aseniero for getting our paper 'Activity River: Visualizing Planned and Logged Personal Activities for Reflection' accepted at AVI 2020, and to Jorin Weatherston for publishing our Late Breaking Work at CHI entitled 'Visualizing Unquantifiable Uncertainty in Drug Checking Test Results'.
-
Oct. 2019
One more IEEE VIS conference! This year, UViz is represented with two co-authored InfoVis papers: What is Interaction for Data Visualization? led by Evanthia Dimara; and Investigating Direct Manipulation of Graphical Encodings as a Method for User Interaction led by Bahador Saket and with Samuel Huron and Alex Endert. Jorin Weatherston will also present his poster on 'Visualizing Unquantifiable Uncertainty in Drug Checking Test Results', in collaboration with Peggy Storey. Jorin, Andrea Castaneda and Jimmy Lai will be attending VIS for the first time, and for the first time UVic will co-sponsor the publicly acclaimed and award-winning West Coast Party.
-
Aug. 2019
Five grad students joined the UViz research group. Andrea Castaneda Bueno (MSc), Jimmy Lai (MSc), Maybins Lengwe (PhD, with Jens Weber), and Mona Malik (MSc) are starting at UVic. Jan Hombeck is also joining us as a visiting Masters student from Koblenz, Germany (with Kai Lawonn).
-
Jun. 2019
I participated in the Dagstuhl seminar on Mobile Visualization.
Project Highlights
Structure and Empathy in Visual Data Storytelling
DESCRIPTION_SHORT
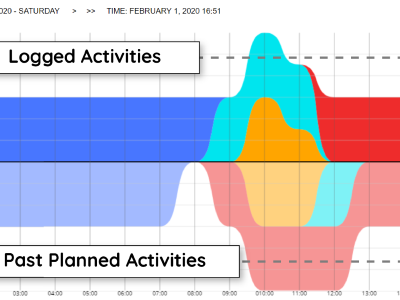
Activity River
Activity River is a personal visualization tool which enables individuals to plan, log, and reflect on their self-defined activities.
What is Interaction for Data Visualization?
We extract commonalities and differences between the views of interaction in visualization and in HCI to synthesize a definition of interaction for visualization - a thinking tool to inspire novel and bolder interaction design practices.
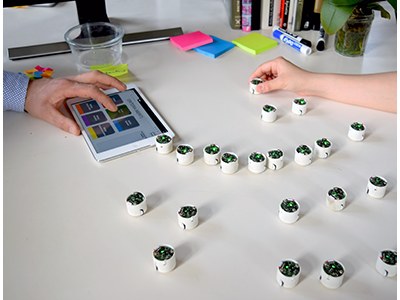
Dynamic Composite Data Physicalization
Dynamic composite physicalizations are a new class of physical visualizations that use collections of self-propelled objects to represent data
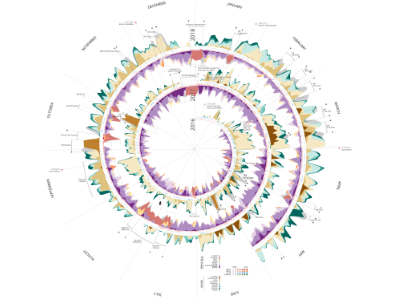
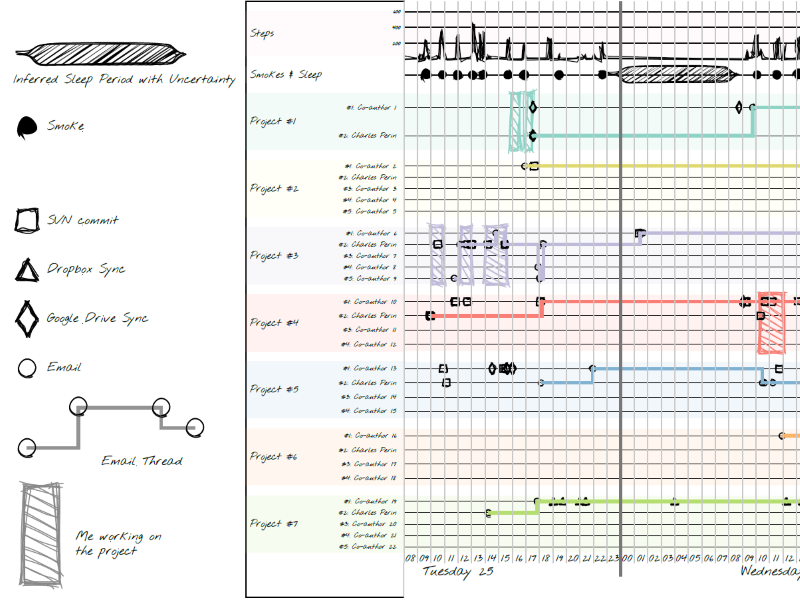
The Symmetry of My Life II
An updated autobiographical visualization of the past 30 months of my life that shows work and personal activities, steps, floors, emails, SVN commits, and contextual annotations.
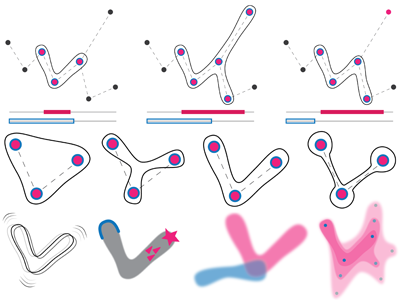
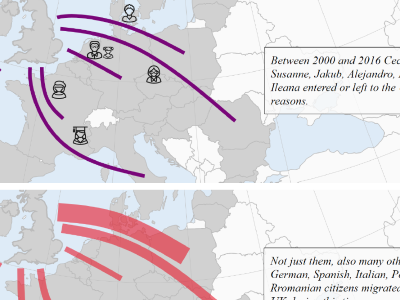
Geoblobs
GeoBlob is an abstract representation of spatio-temporal data dedicated to conveying uncertain positions and uncertain temporal information of entities that move over time.
Active Reading
An exploration of Active Reading of Visualizations that provides evidence that people do more than simply looking when presented visualizations.
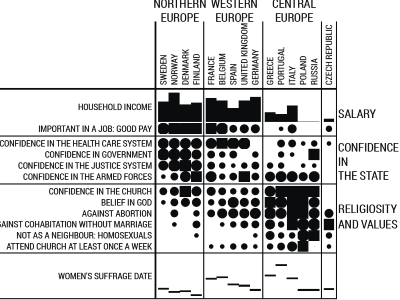
Bertifier
Bertifier is a Web app for rapidly creating tabular visualizations from spreadsheets that directly draws from Jacques Bertin's matrix analysis method.
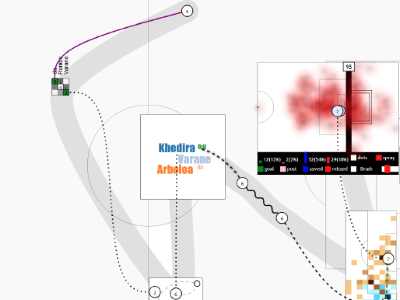
SoccerStories
SoccerStories is a visualization interface to support analysts in exploring soccer data and communicating insights on abstracted phases extracted from soccer games.
Latest Blog Posts
Feel the CHI 2016 Deadline
Last year for the CHI 2016 deadline I logged quite a lot of data between the end of August 2015 and the day of the deadline, Friday September 25, 2015, at noon. Here is an overview of this peculiar experience.
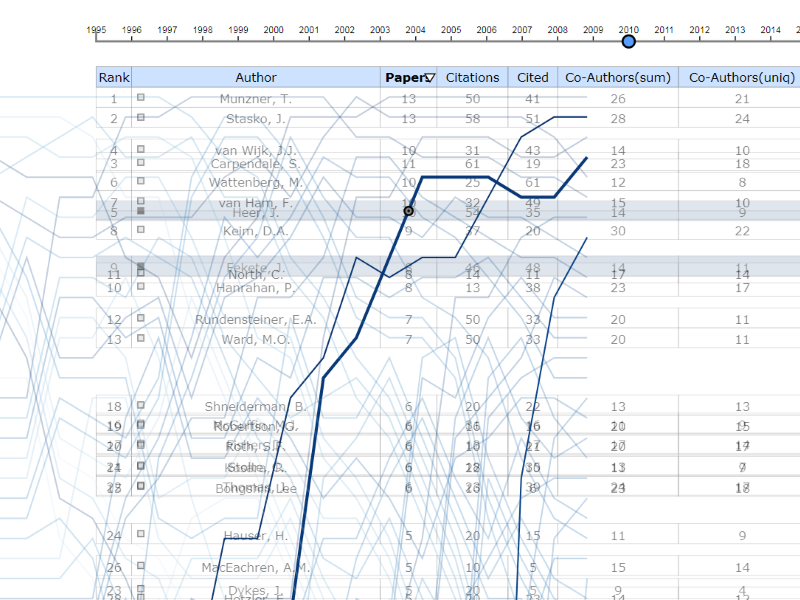
Drag VIS Publications
Direct manipulation of the IEEE VIS publication dataset.