SoccerStories: A Kick-off for Visual Soccer Analysis


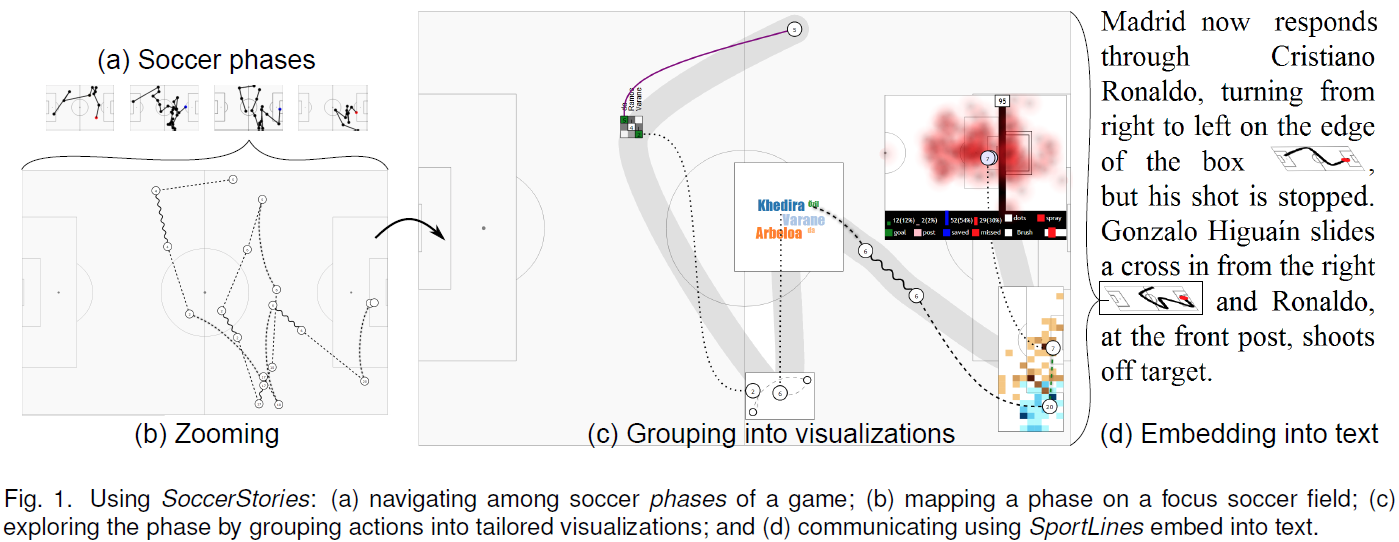
SoccerStories is a visualization interface to support analysts in exploring soccer data and communicating interesting insights. Currently, most analyses on such data relate to statistics on individual players or teams. However, soccer analysts we collaborated with consider that quantitative analysis alone does not convey the right picture of the game, as context, player positions and phases of player actions are the most relevant aspects. We designed SoccerStories to support the current practice of soccer analysts and to enrich it, both in the analysis and communication stages. Our system provides an overview+detail interface of game phases, and their aggregation into a series of connected visualizations, each visualization being tailored for actions such as a series of passes or a goal attempt. To evaluate our tool, we ran two qualitative user studies on recent games using SoccerStories with data from one of the world's leading live sports data providers. The first study resulted in a series of four articles on soccer tactics, by a tactics analyst, who said he would not have been able to write these otherwise. The second study consisted in an exploratory follow-up to investigate design alternatives for embedding soccer phases into word-sized graphics. For both experiments, we received a very enthusiastic feedback and participants consider further use of SoccerStories to enhance their current workflow.
High-resolution screenshots
Click on the images to download the high-resolution png versions.
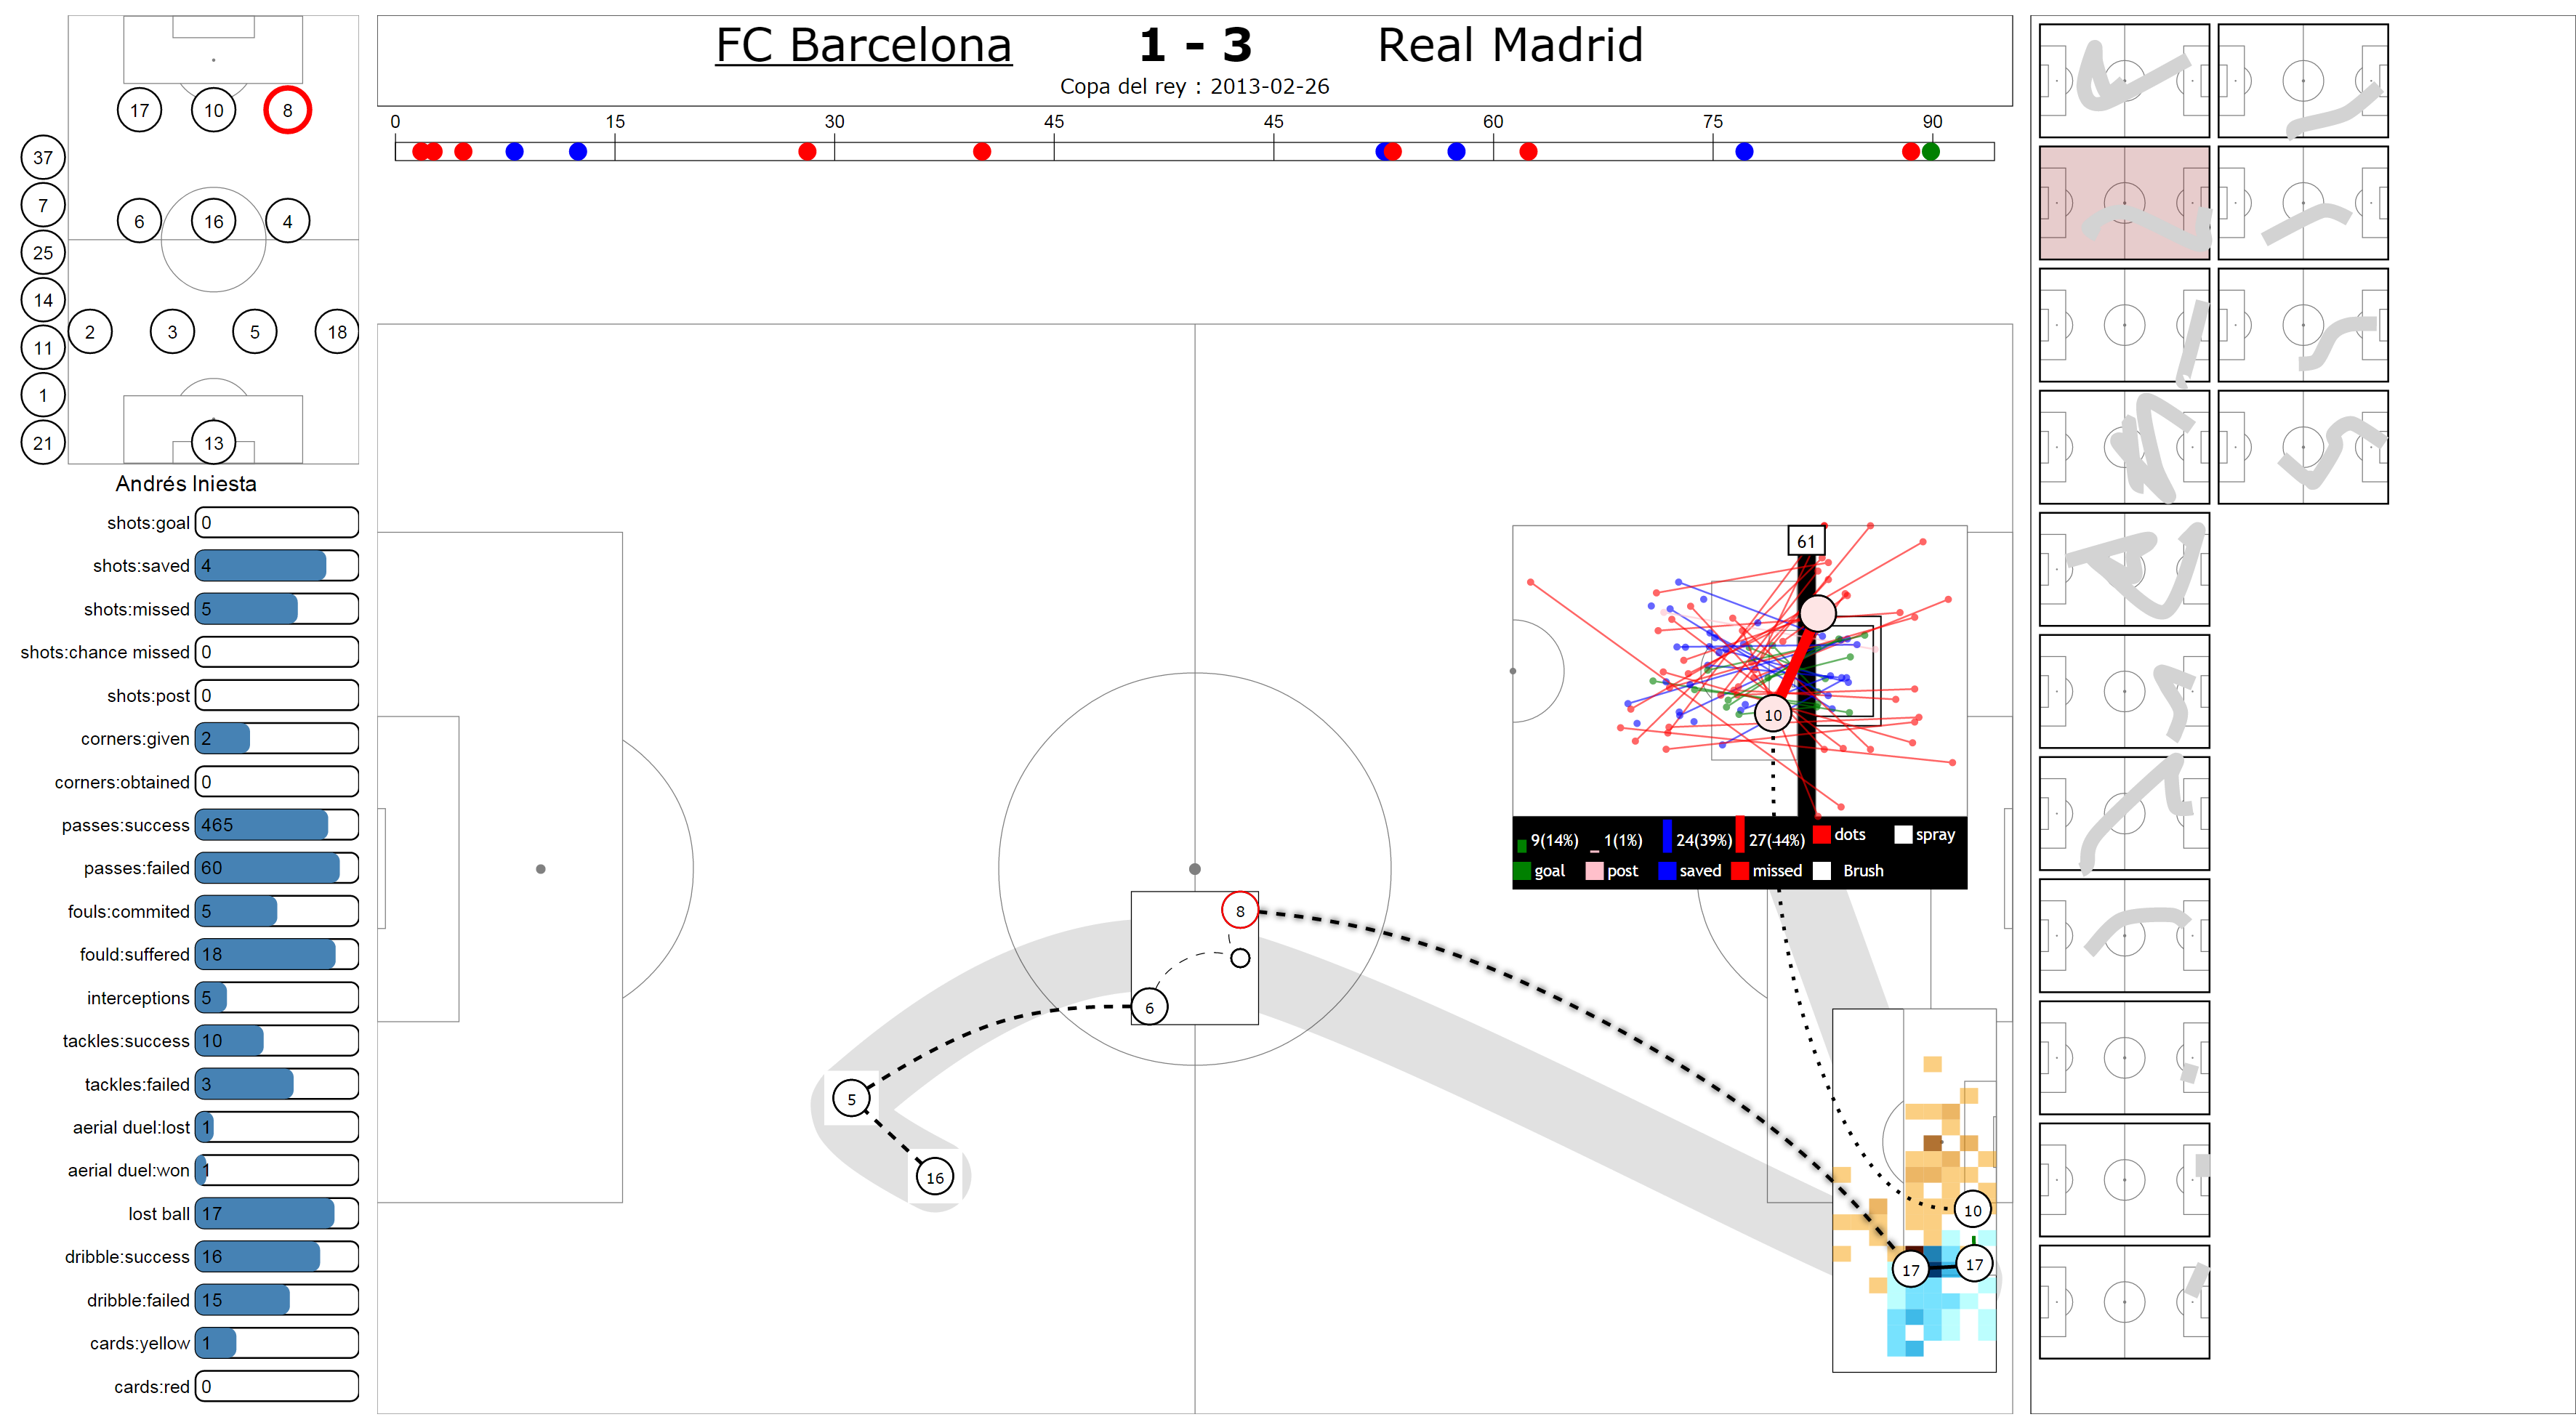
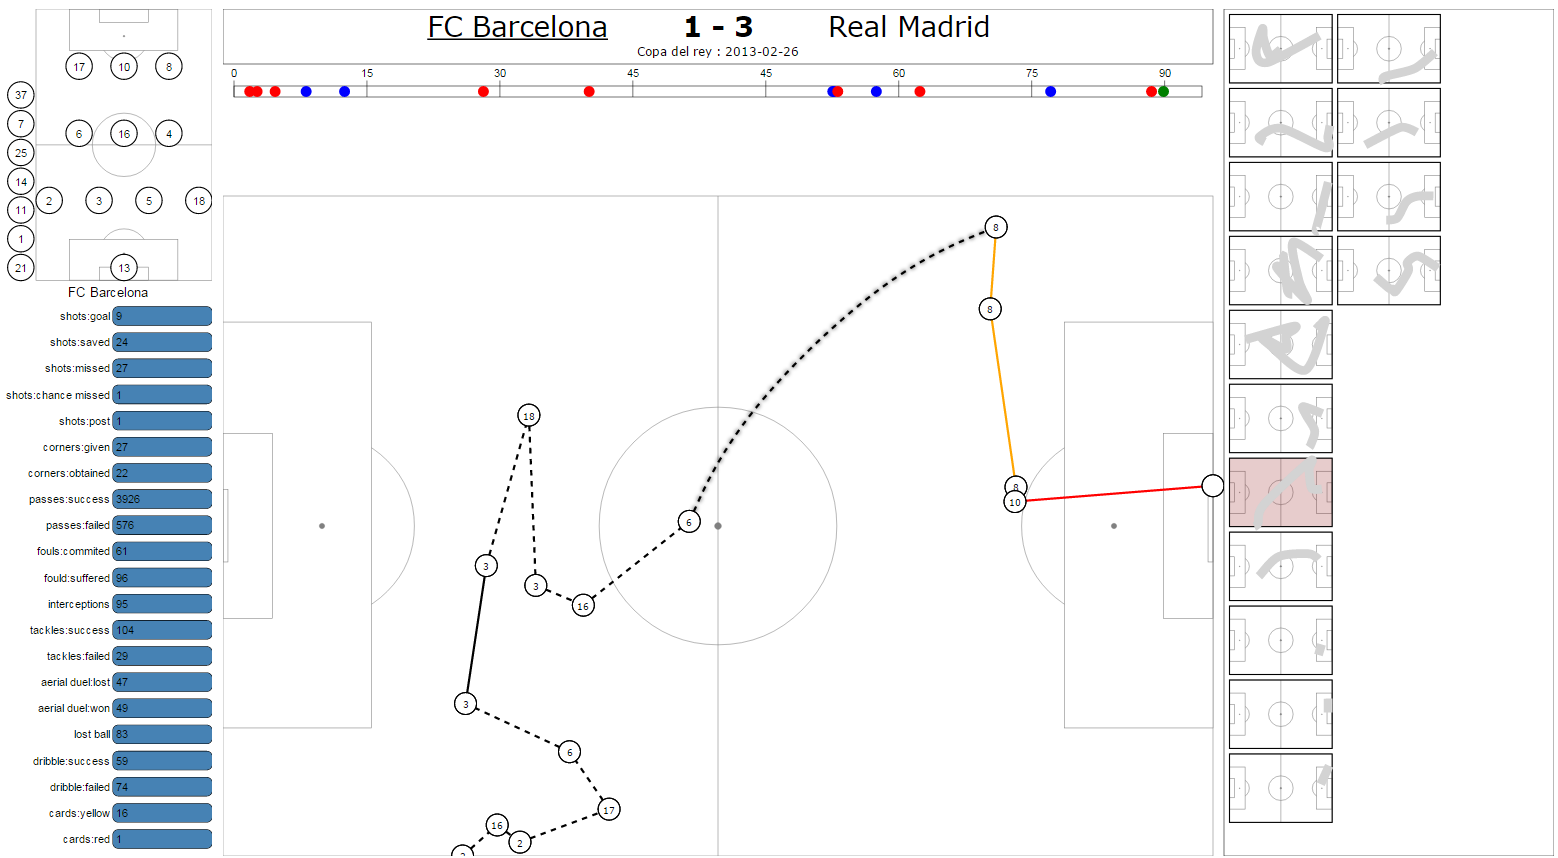
Interface
Phases small multiples variations
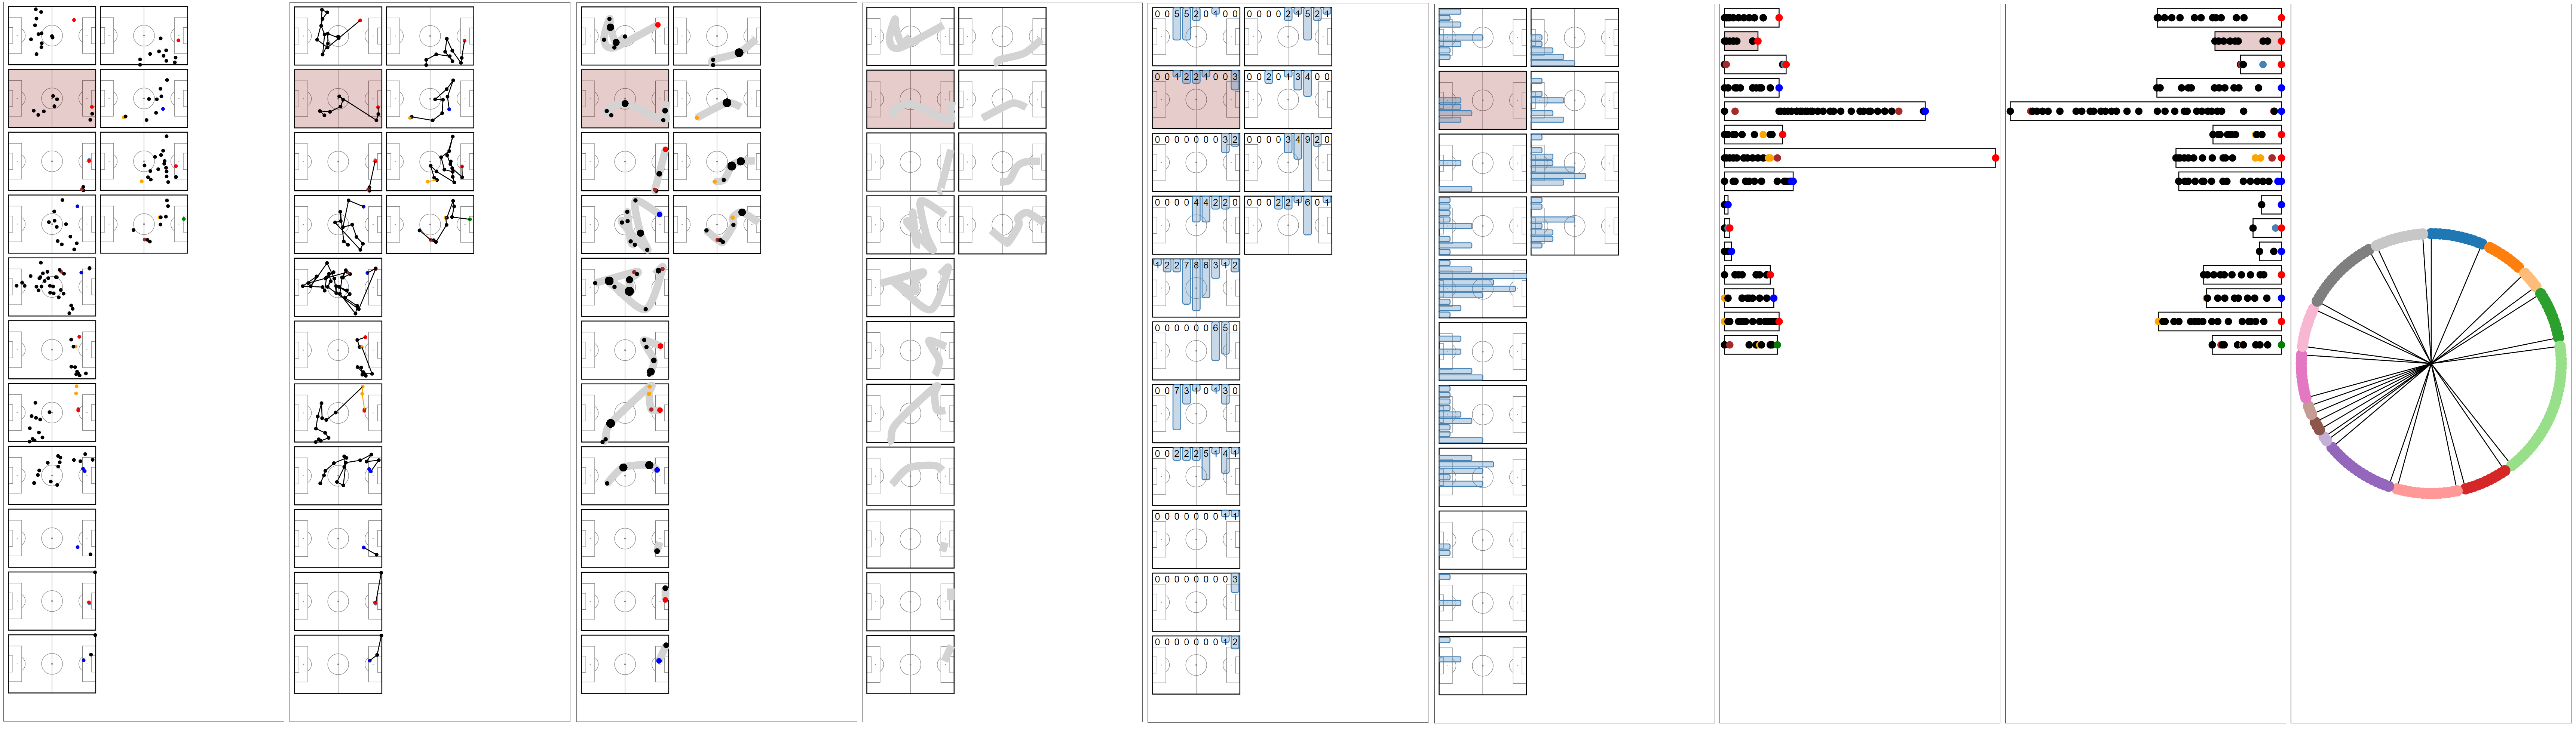
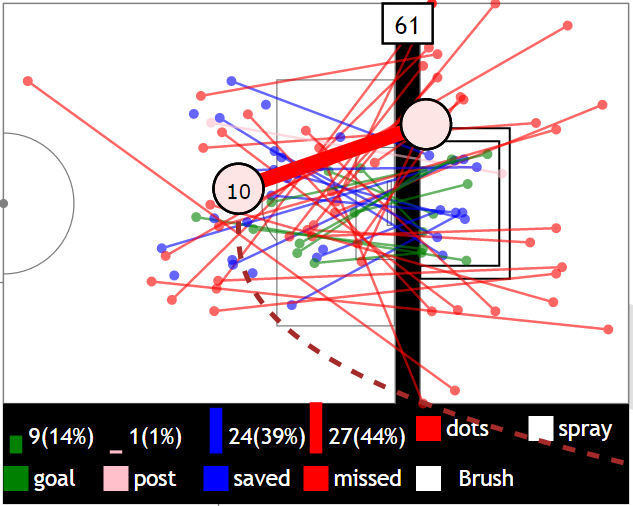
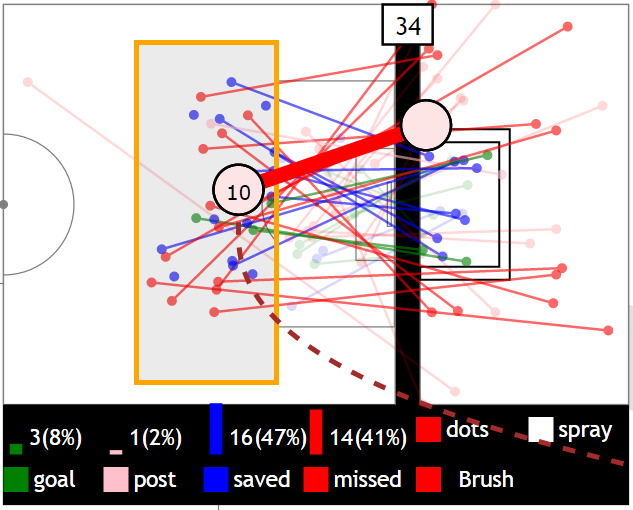
Faceted views of a shot on goal
From left to right: default view; with brushing; with "spray" mode

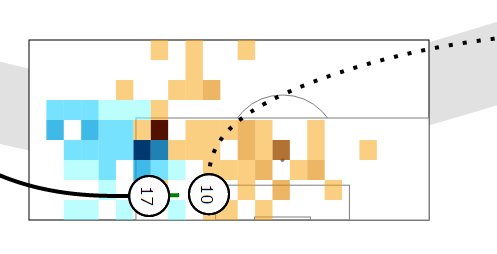
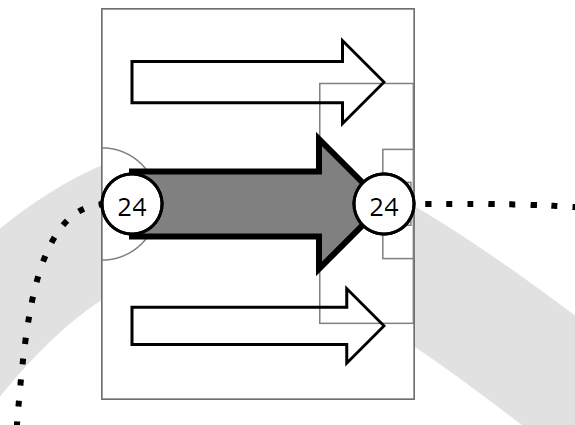
Faceted views of crossover/corner kicks and long runs
< Crossover
Long run >
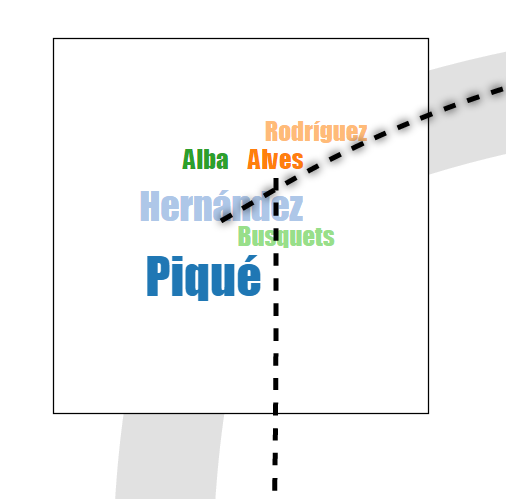
A series of passes in a phase represented using different faceted views
< Original phase
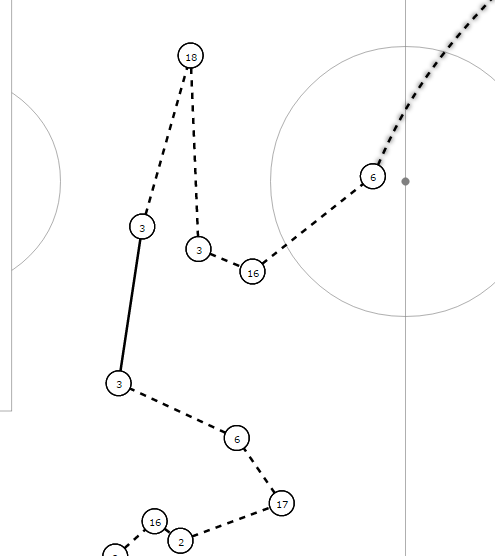
< Original group of passes
Using a complete node-link >
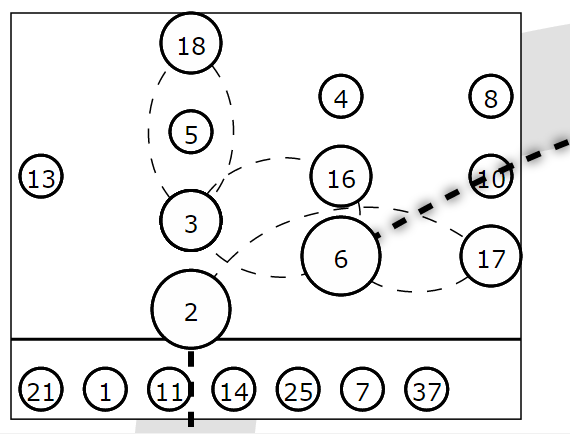
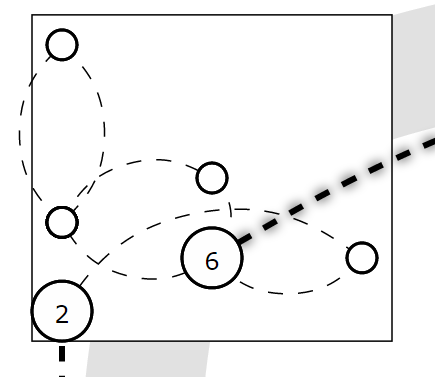
< Using a filtered node-link
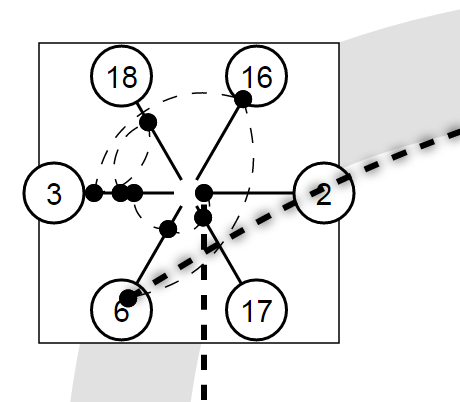
Using a hiveplot >

< Using an adjacency matrix
Using a tag cloud >