
Feel the CHI 2016 Deadline
A personal visualization of the CHI 2016 deadline crunch
Posted 06 Oct 2016
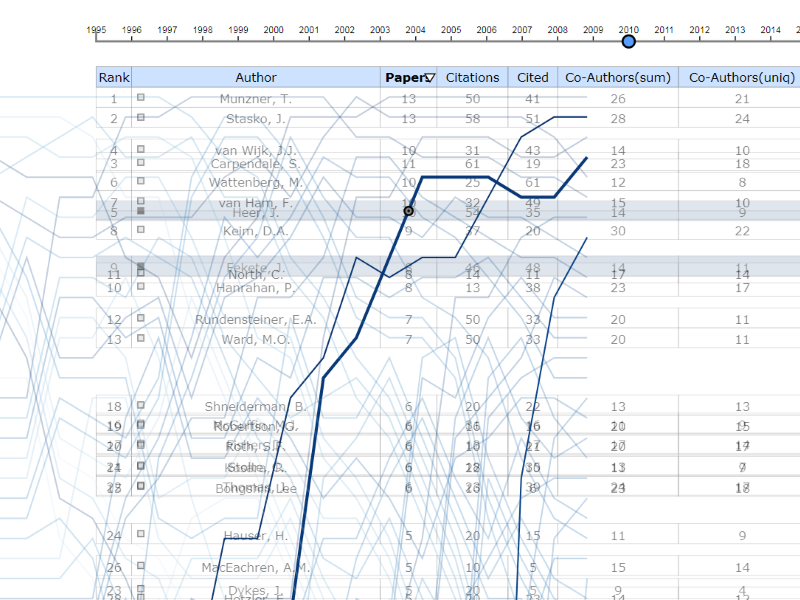
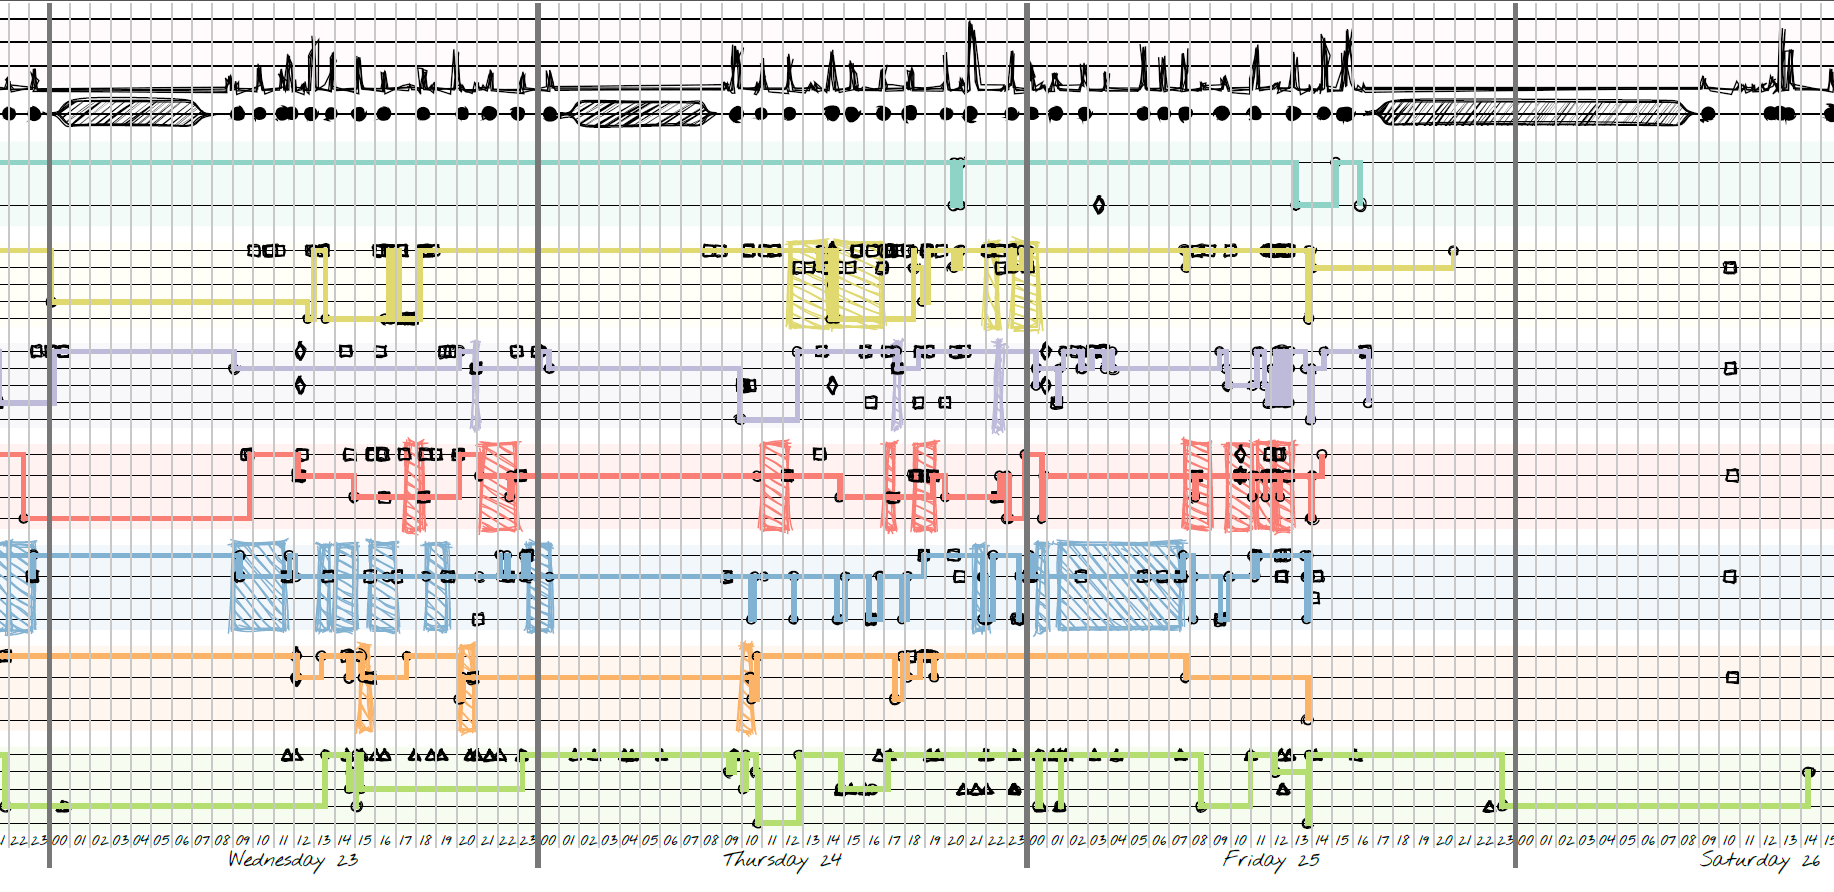
Last year for the CHI 2016 deadline I logged quite a lot of data between the end of August 2015 and the day of the deadline, Friday September 25, 2015, at noon. Here is an overview of this peculiar experience.
You can download the very large pdf by clicking this link or the teaser image above.
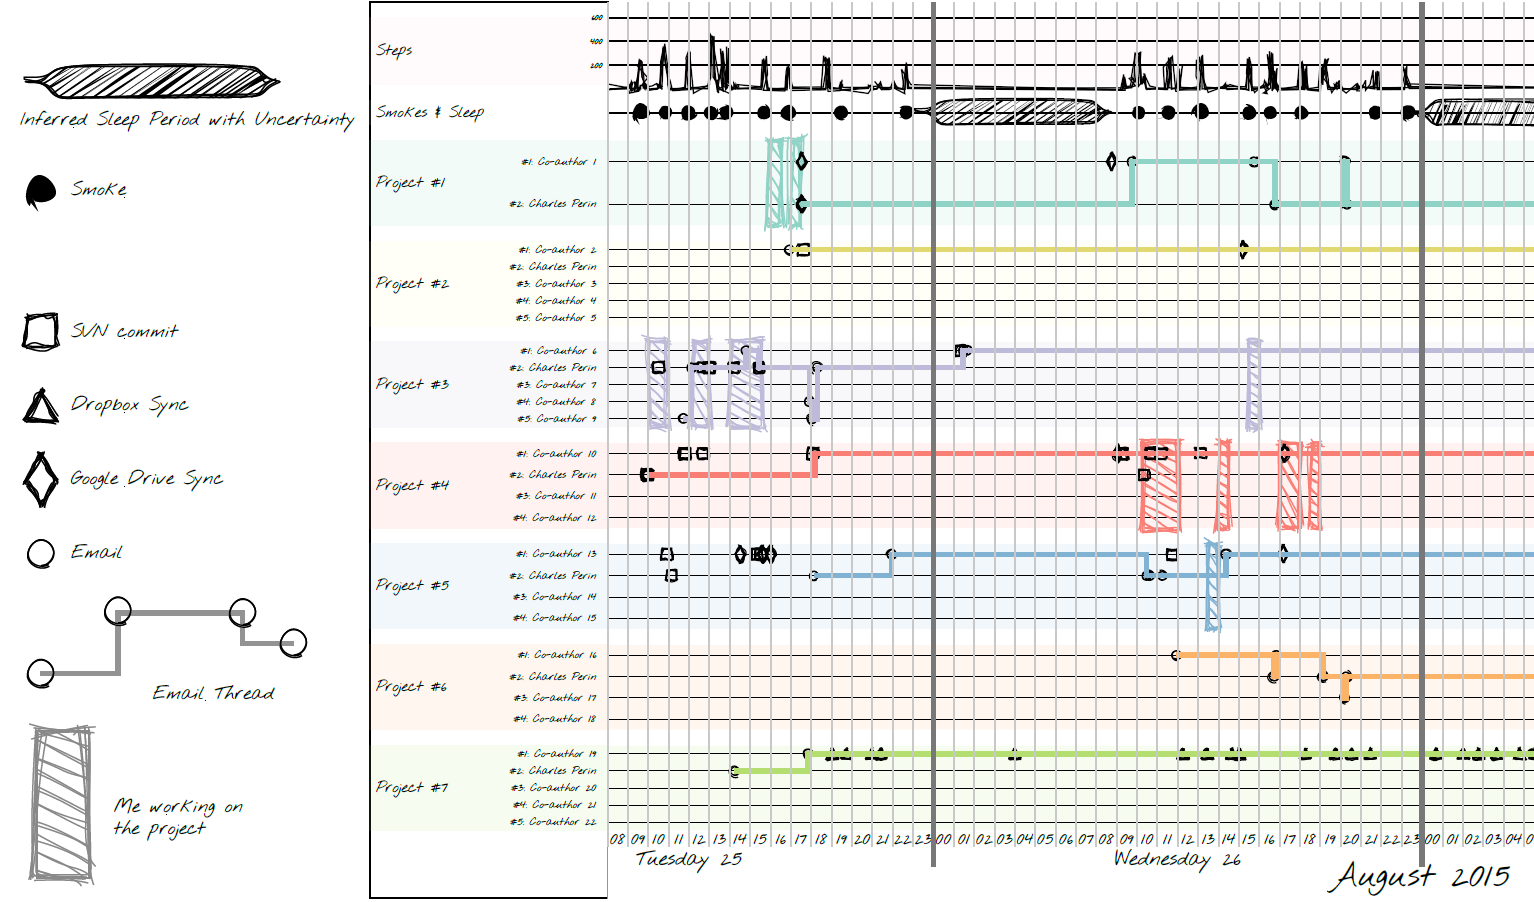
For the sketchy style, I used this sketchy rendering d3 plugin, inspired from the handy sketchy rendering library for Processing (you can find the research paper here). I used a sketchy style to convey both the uncertainty in the data and the manual data collection process. I created a visualization in d3, and this image is just an export of the resulting vector graphics image. Note that for anonymization purposes, I added a bit of noise and randomness in the data.
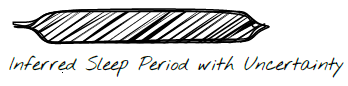
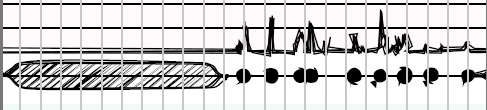
Sleep is important. Keeping track of sleep is very annoying. How do you know when you actually start sleeping? At this time I did not have a good enough sleep tracker. So I algorithmically extracted my sleep based on my inactivity, assuming that I would not walk nor smoke too much while sleeping. The weird shape is here to convey the uncertainty in the data.

At this point I was trying to quit smoking, and I foolishly thought that logging and visualizing my smokes would help me achieve this goal. I switched to e-cigarettes before finding the time to visualize my smoke data. However, I have it, so why not plotting it on this timeline?
The most amusing fact probably is that looking at the timeline, the more I smoked, the more I walked. The reason is quite simple: I needed to go outside. Given that I almost never walked if it was not for smoking, I now wonder to which extent smoking can actually be healthy.
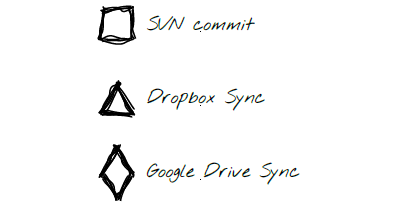
People have different habits and working on a project usually involves several data sources to look at. I was interested in identifying revisions. If with SVN or git, it's pretty straightforward, it is not that simple with tools like Dropbox and Google Drive. I had to determine empirically reasonable heuristics so that each CTRL+S in a shared text file would not count as a revision. I ended up with aggregating all Dropbox syncs (or Google Drive syncs) from the same person when the time interval between two syncs was under five minutes. This is quite arbitrary, but worked fine in my case.
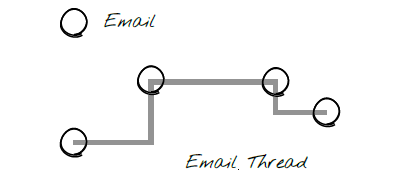
Emails are very important in the writing of papers. Looking at the frequency of emails and the shape of email threads gives interesting insights regarding the patterns that appear in different projects.
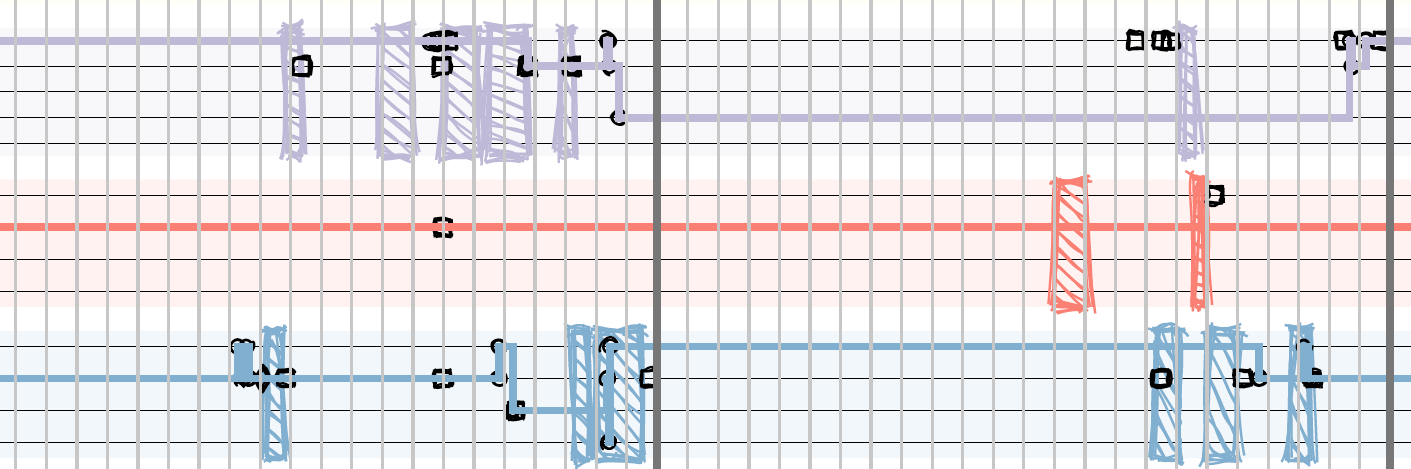
Because this is a personal visualization, I had to emphasize myself. Also, I could only collect data bout "who is working on a project" for myself. These hashed rectangles appear in a project when I was actively working on a project.
My favorite part is of course the end of the image. As the deadline approaches, the visualization gets more and more cluttered, the nights become shorter, and the numbers of smokes, emails and syncs increase. All abruptly stop on Friday, September 25 around 2PM, which was of course the deadline time. Followed a few emails and a 14 hours nap to catch up for skipping the previous night.
There is even a video of it, with which I experienced with some sonification: