Structure and Empathy in Visual Data Storytelling: Evaluating their Influence on Attitude


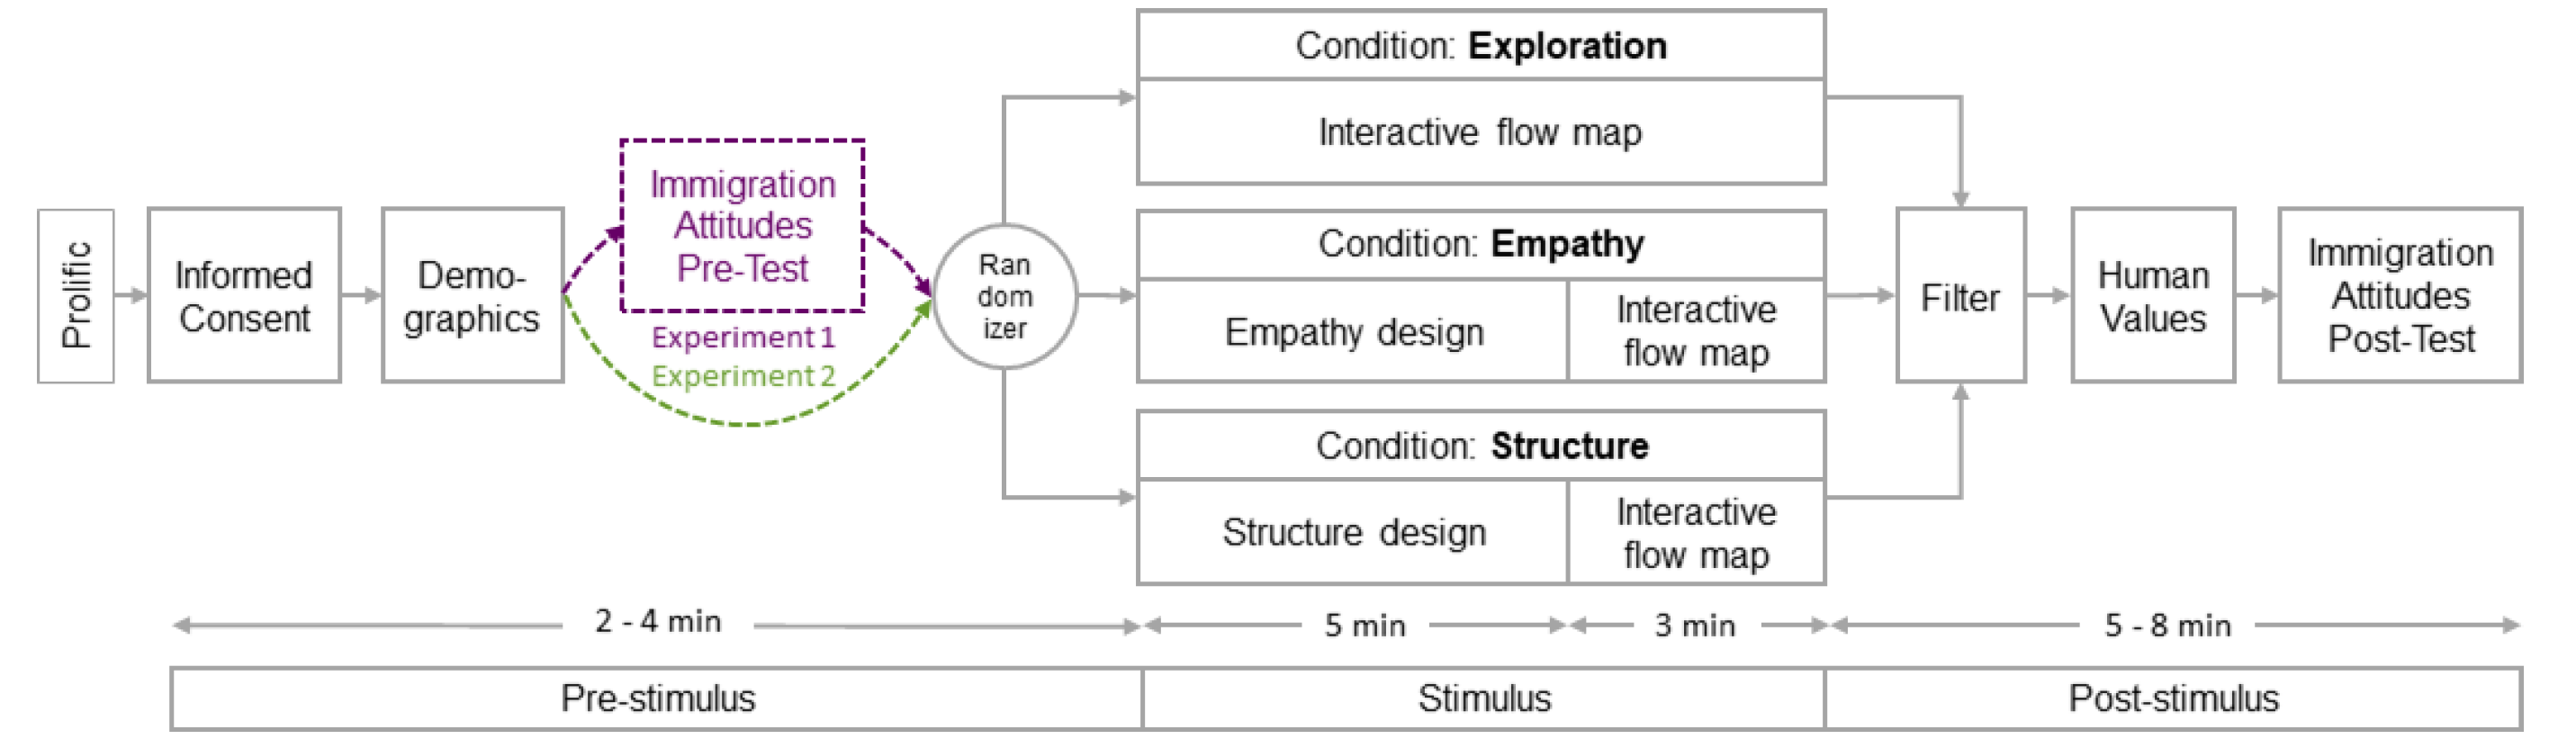
In the visualization community, it is often assumed that visual data storytelling increases memorability and engagement, making it more effective at communicating information. However, many assumptions about the efficacy of storytelling in visualization lack empirical evaluation. Contributing to an emerging body of work, we study whether selected techniques commonly used in visual data storytelling influence people’s attitudes towards immigration. We compare (a) personal visual narratives designed to generate empathy; (b) structured visual narratives of aggregates of people; and (c) an exploratory visualization without narrative acting as a control condition. We conducted two crowdsourced between-subject studies comparing the three conditions, each with 300 participants. To assess the differences in attitudes between conditions, we adopted established scales from the social sciences used in the European Social Survey (ESS). Although we found some differences between conditions, the effects on people’s attitudes are smaller than we expected. Our findings suggest that we need to be more careful when it comes to our expectations about the effects visual data storytelling can have on attitudes. Additional material: https://flowstory.github.io/attitudes/.