Geoblobs and World War One


Together with The National Archives UK, we have been looking into how visualization can help convey the uncertainty in historical digital records. We have developed GeoBlob, an abstract representation of spatio-temporal data dedicated to conveying uncertain positions and uncertain temporal information of entities that move over time; using hand-written war diaries from World War One as our case study.
GeoBlobs
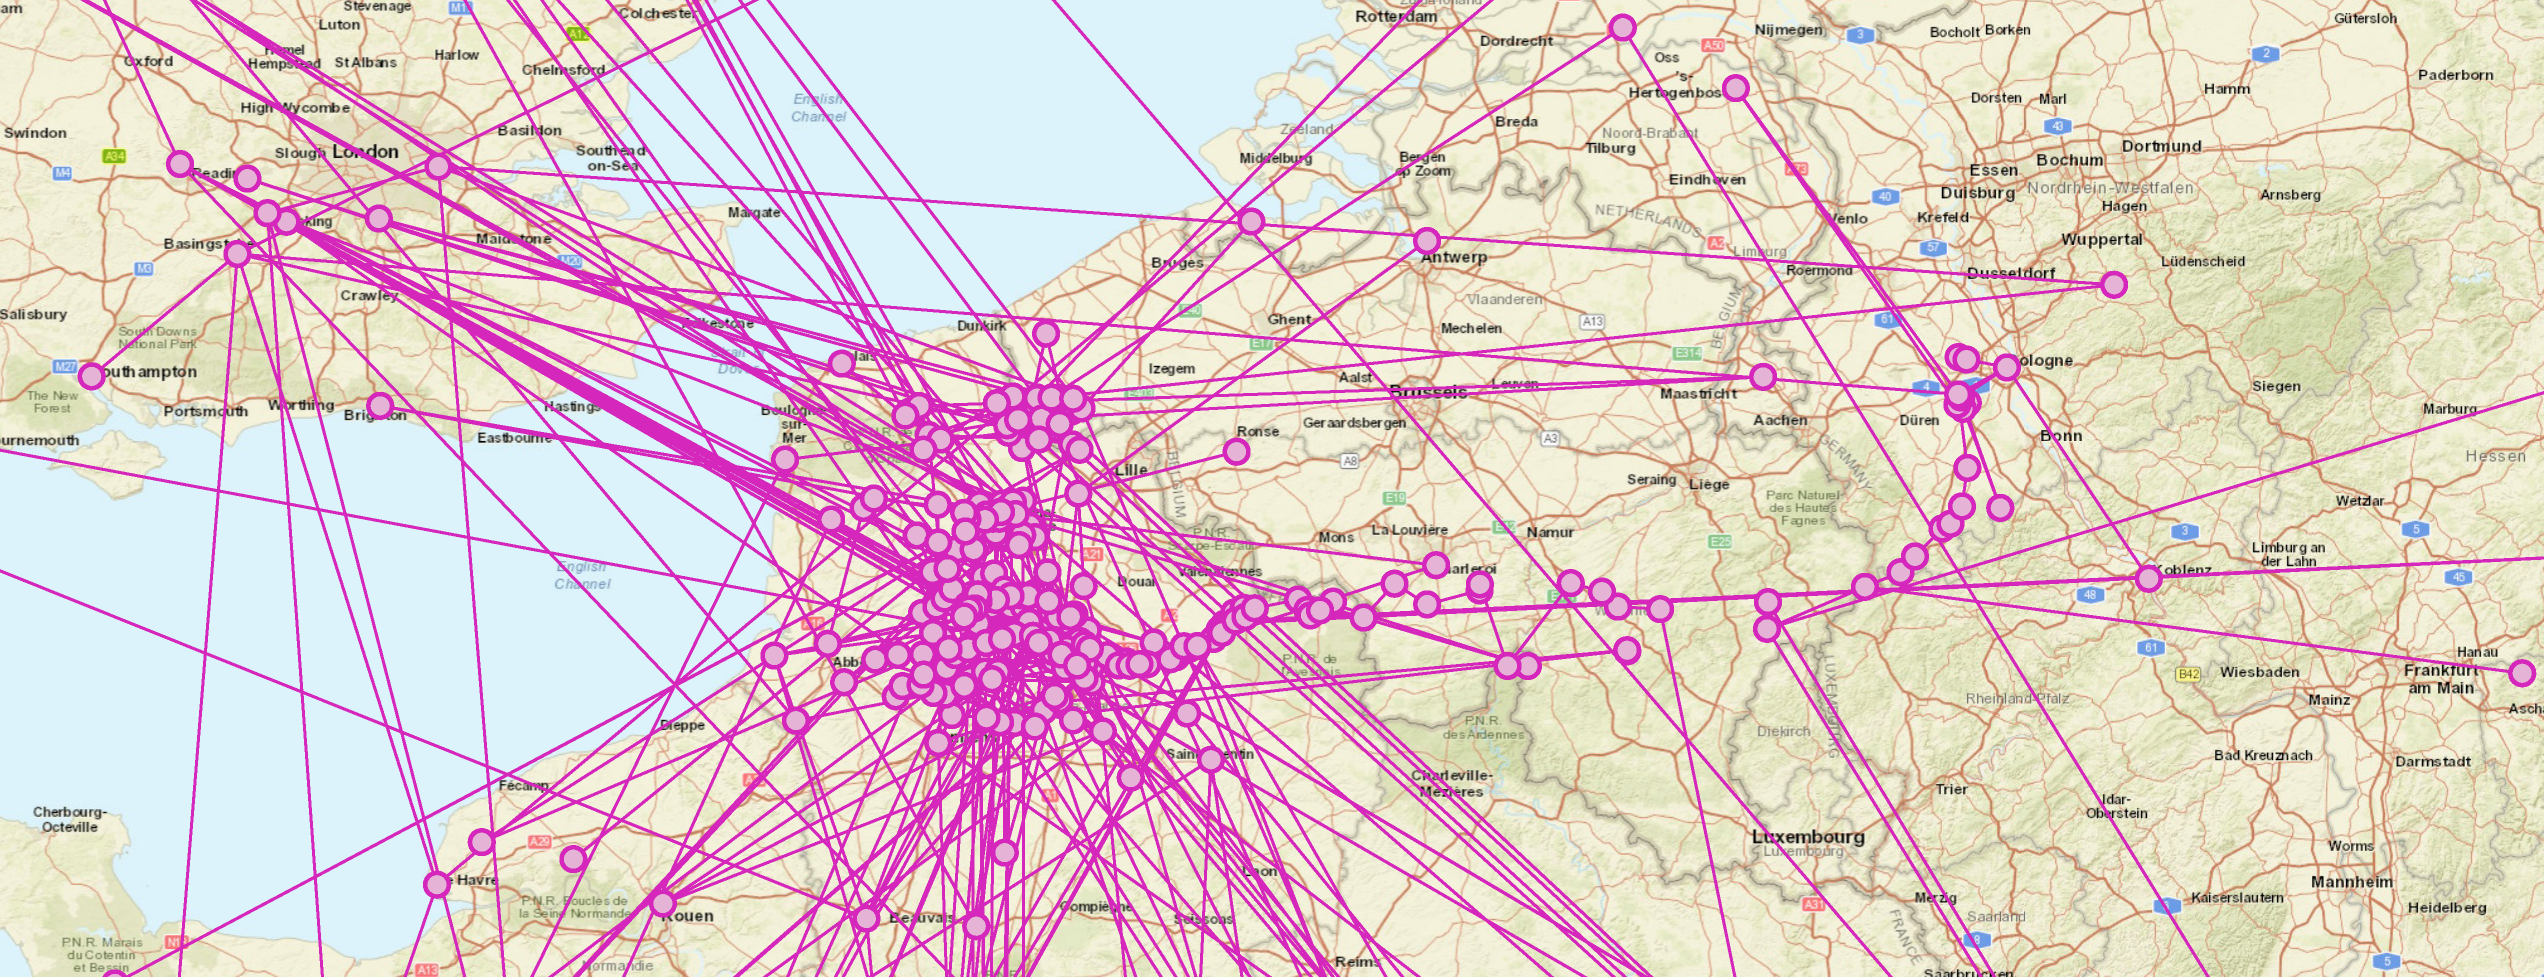
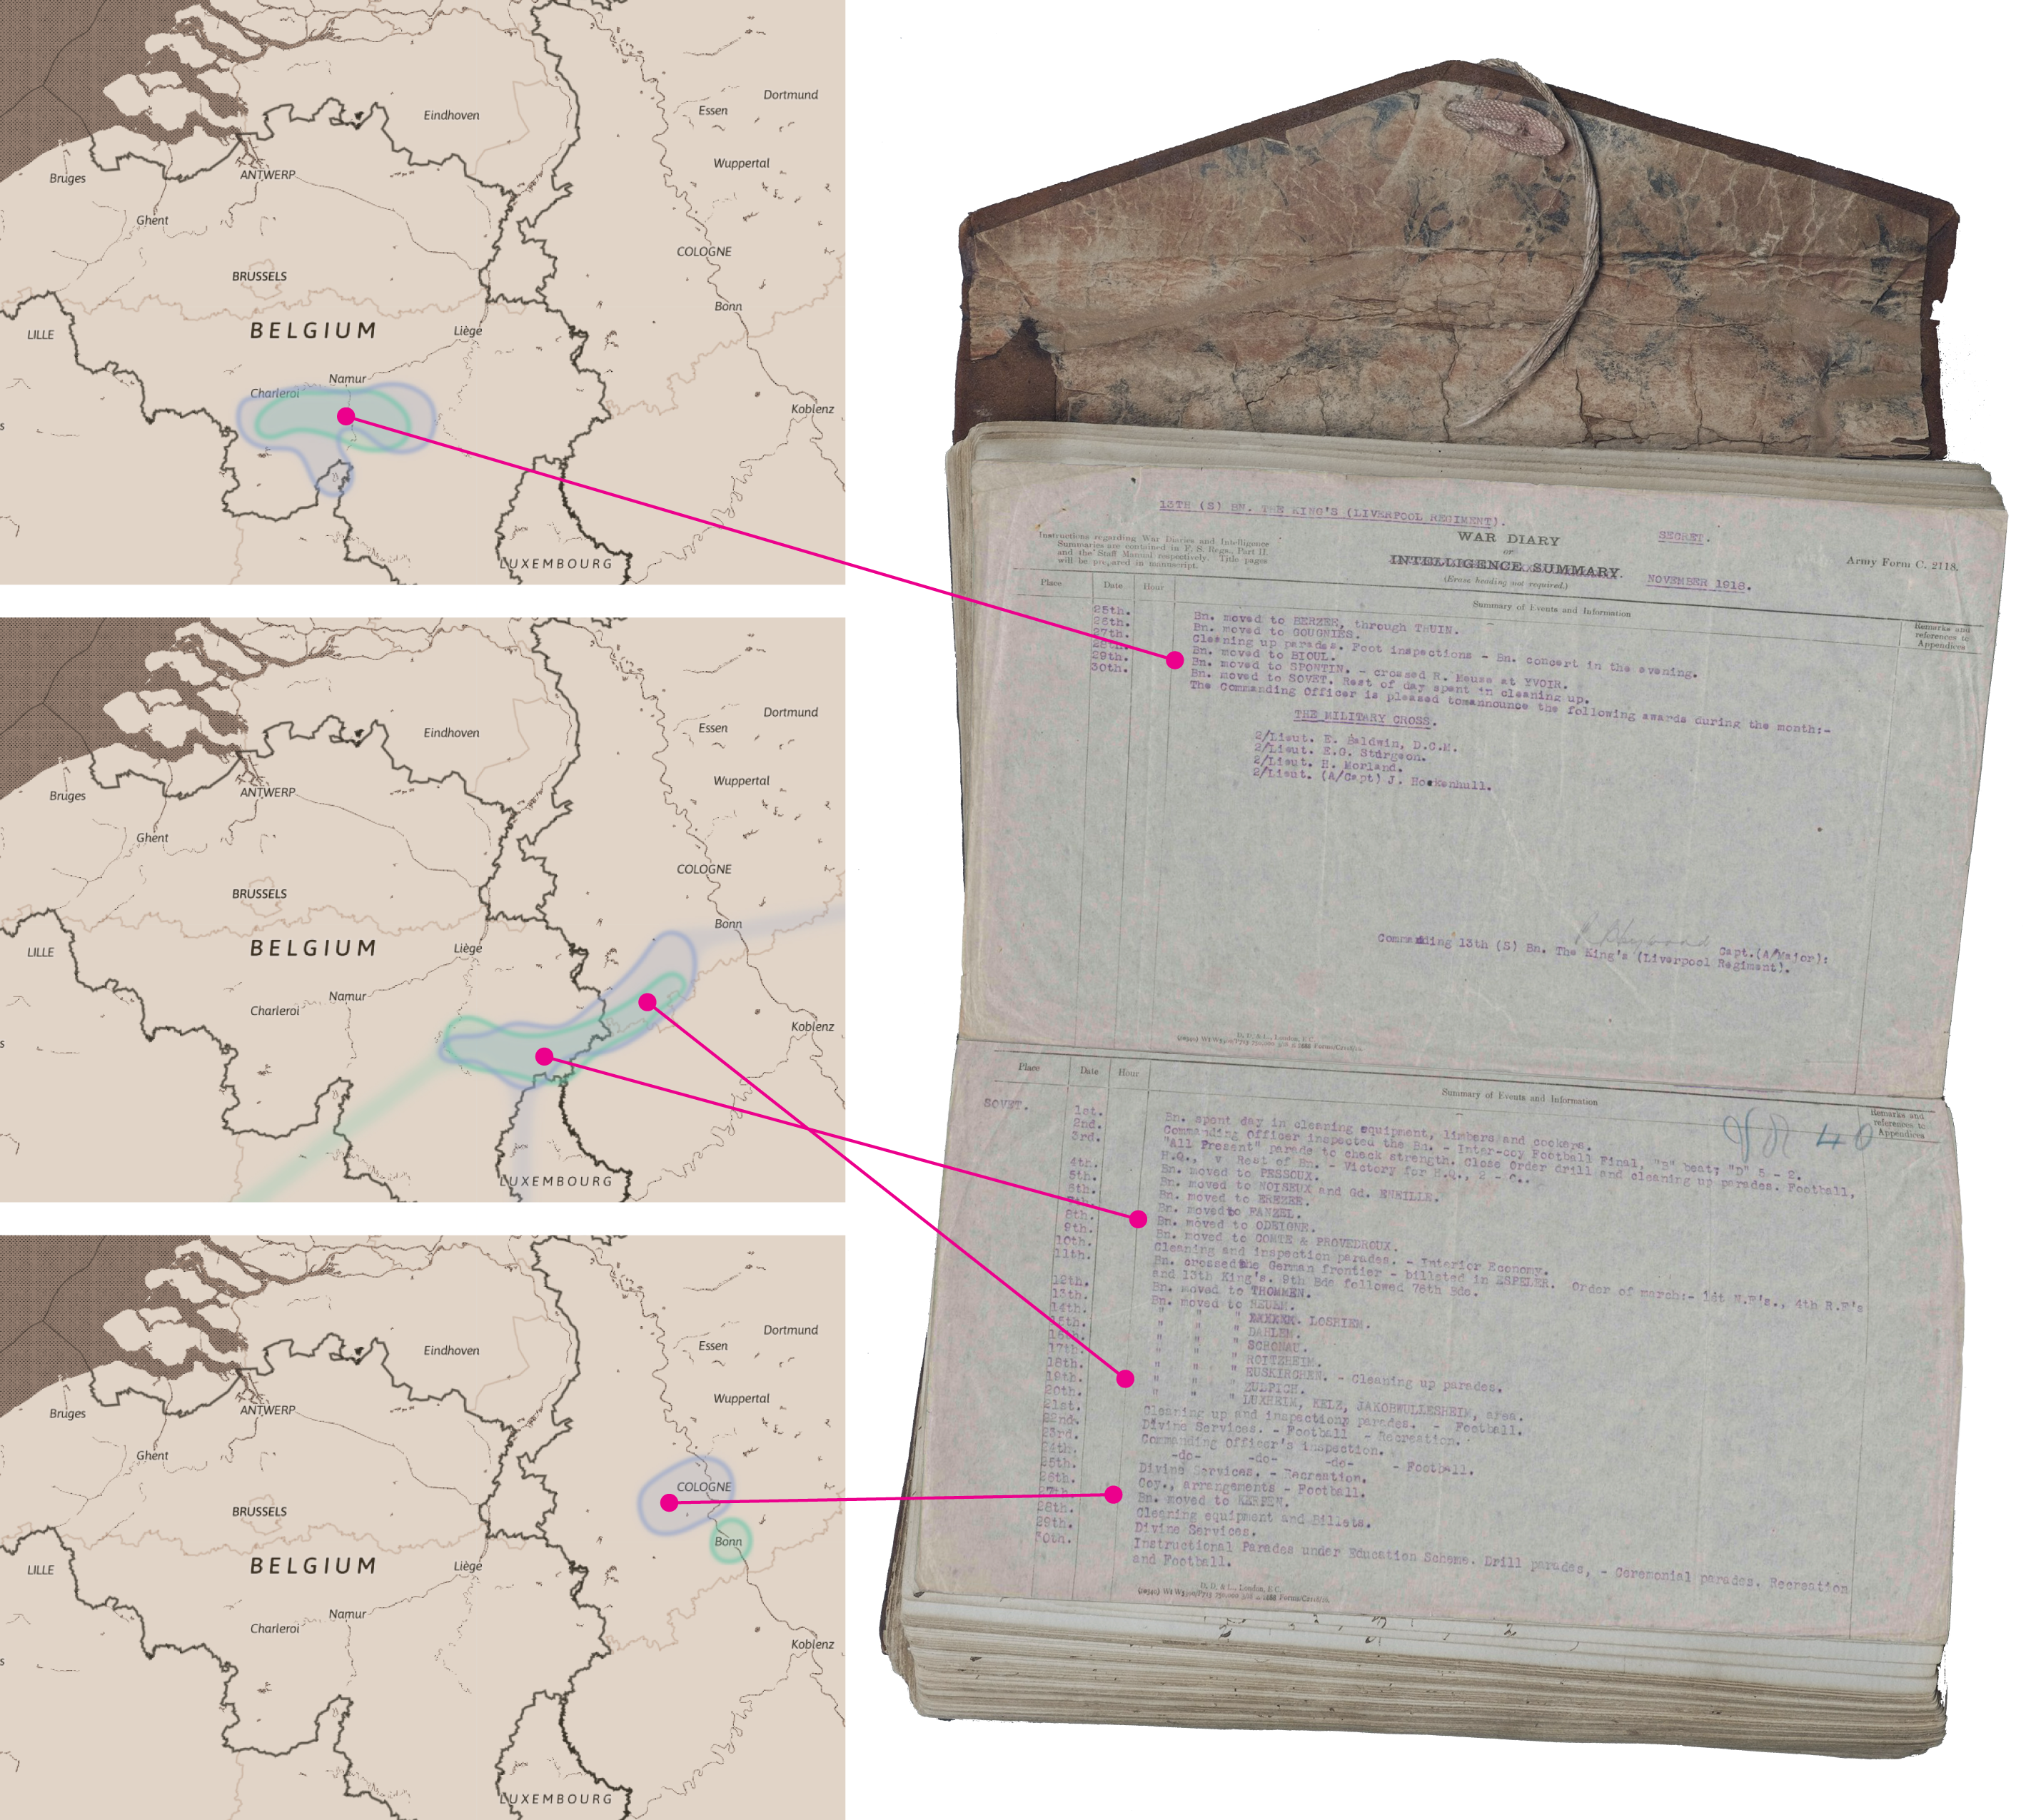
Since 2014, The National Archives (UK) have been digitizing analog, hand-written War Diaries from the First World War (WWI), documenting the story of the British Army and its units on the Western Front. Using the crowdsourcing platform Operation War Diary (OWD), 'citizen historians' tag 1.5 million scanned and archived pages. They classified and annotated essential information on each diary page, generating extensive time-series data about military units, including labels for casualties, unit strength, weather, everyday army life, military activities, soldier names and ranks, location names and dates.
As part of a project between City, University of London and The National Archives that aims to communicate the 'life behind the trenches', we worked on the visual representation of the spatio-temporal data derived from the War Diaries. The digitizing and tagging process introduces uncertainty on many levels due to missing records, misspellings (in original diaries and while digitizing), unreadable parts, lost diaries, the reliability of workers, and also through post-processing of the gathered data. As a result, misspellings and ambiguities during geo-referencing of mentioned place names can result in noisy and cluttered map displays when using common visualizations of movement such as line symbols. Furthermore, locations at which the unit did not reside at the time are also mentioned in the diaries but not identifiable as such (e.g., When a soldier was reported to go on furlough to his hometown only the place name but not the context was digitally collected). Additionally, the data typically do not capture the exact temporal order of locations on a single day.
Instead of giving the illusion that the data is complete and clean, our approach is to leverage this uncertainty to produce a more 'organic' view of a unit’s movement over time.

What a war diary looks like
Naïve direct mapping
Design Space
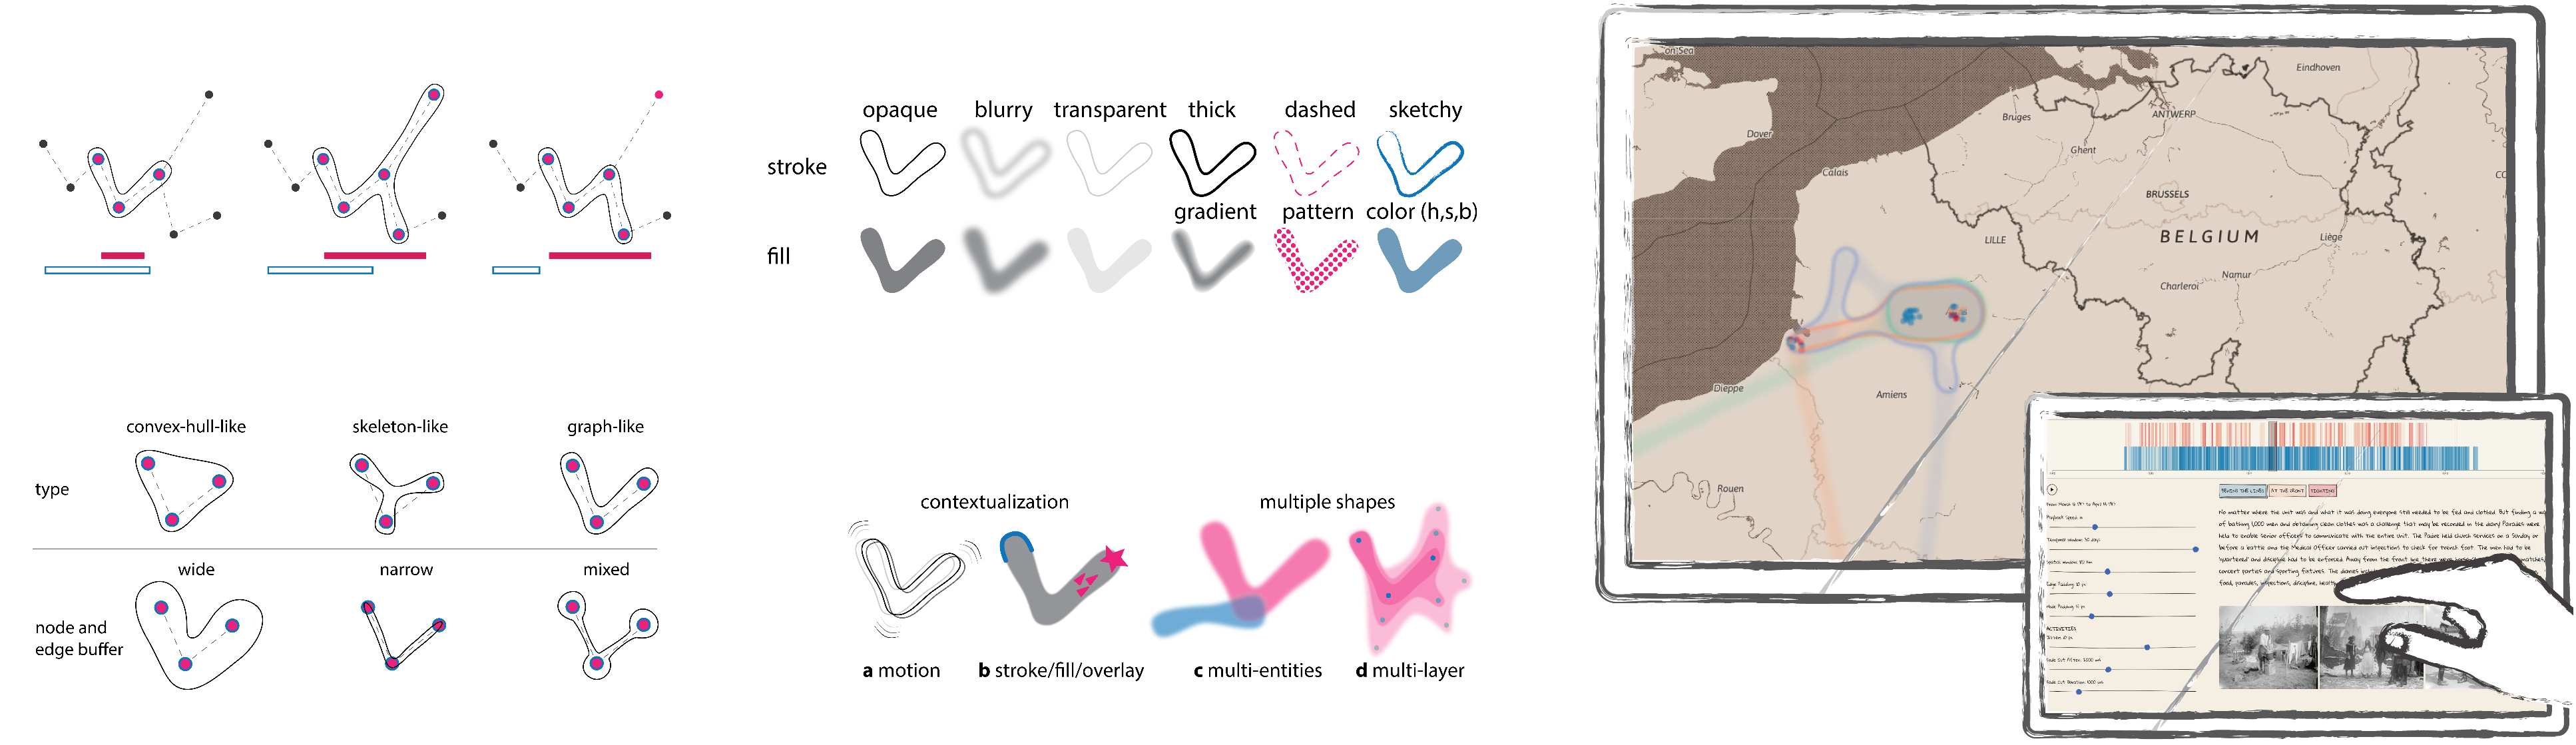
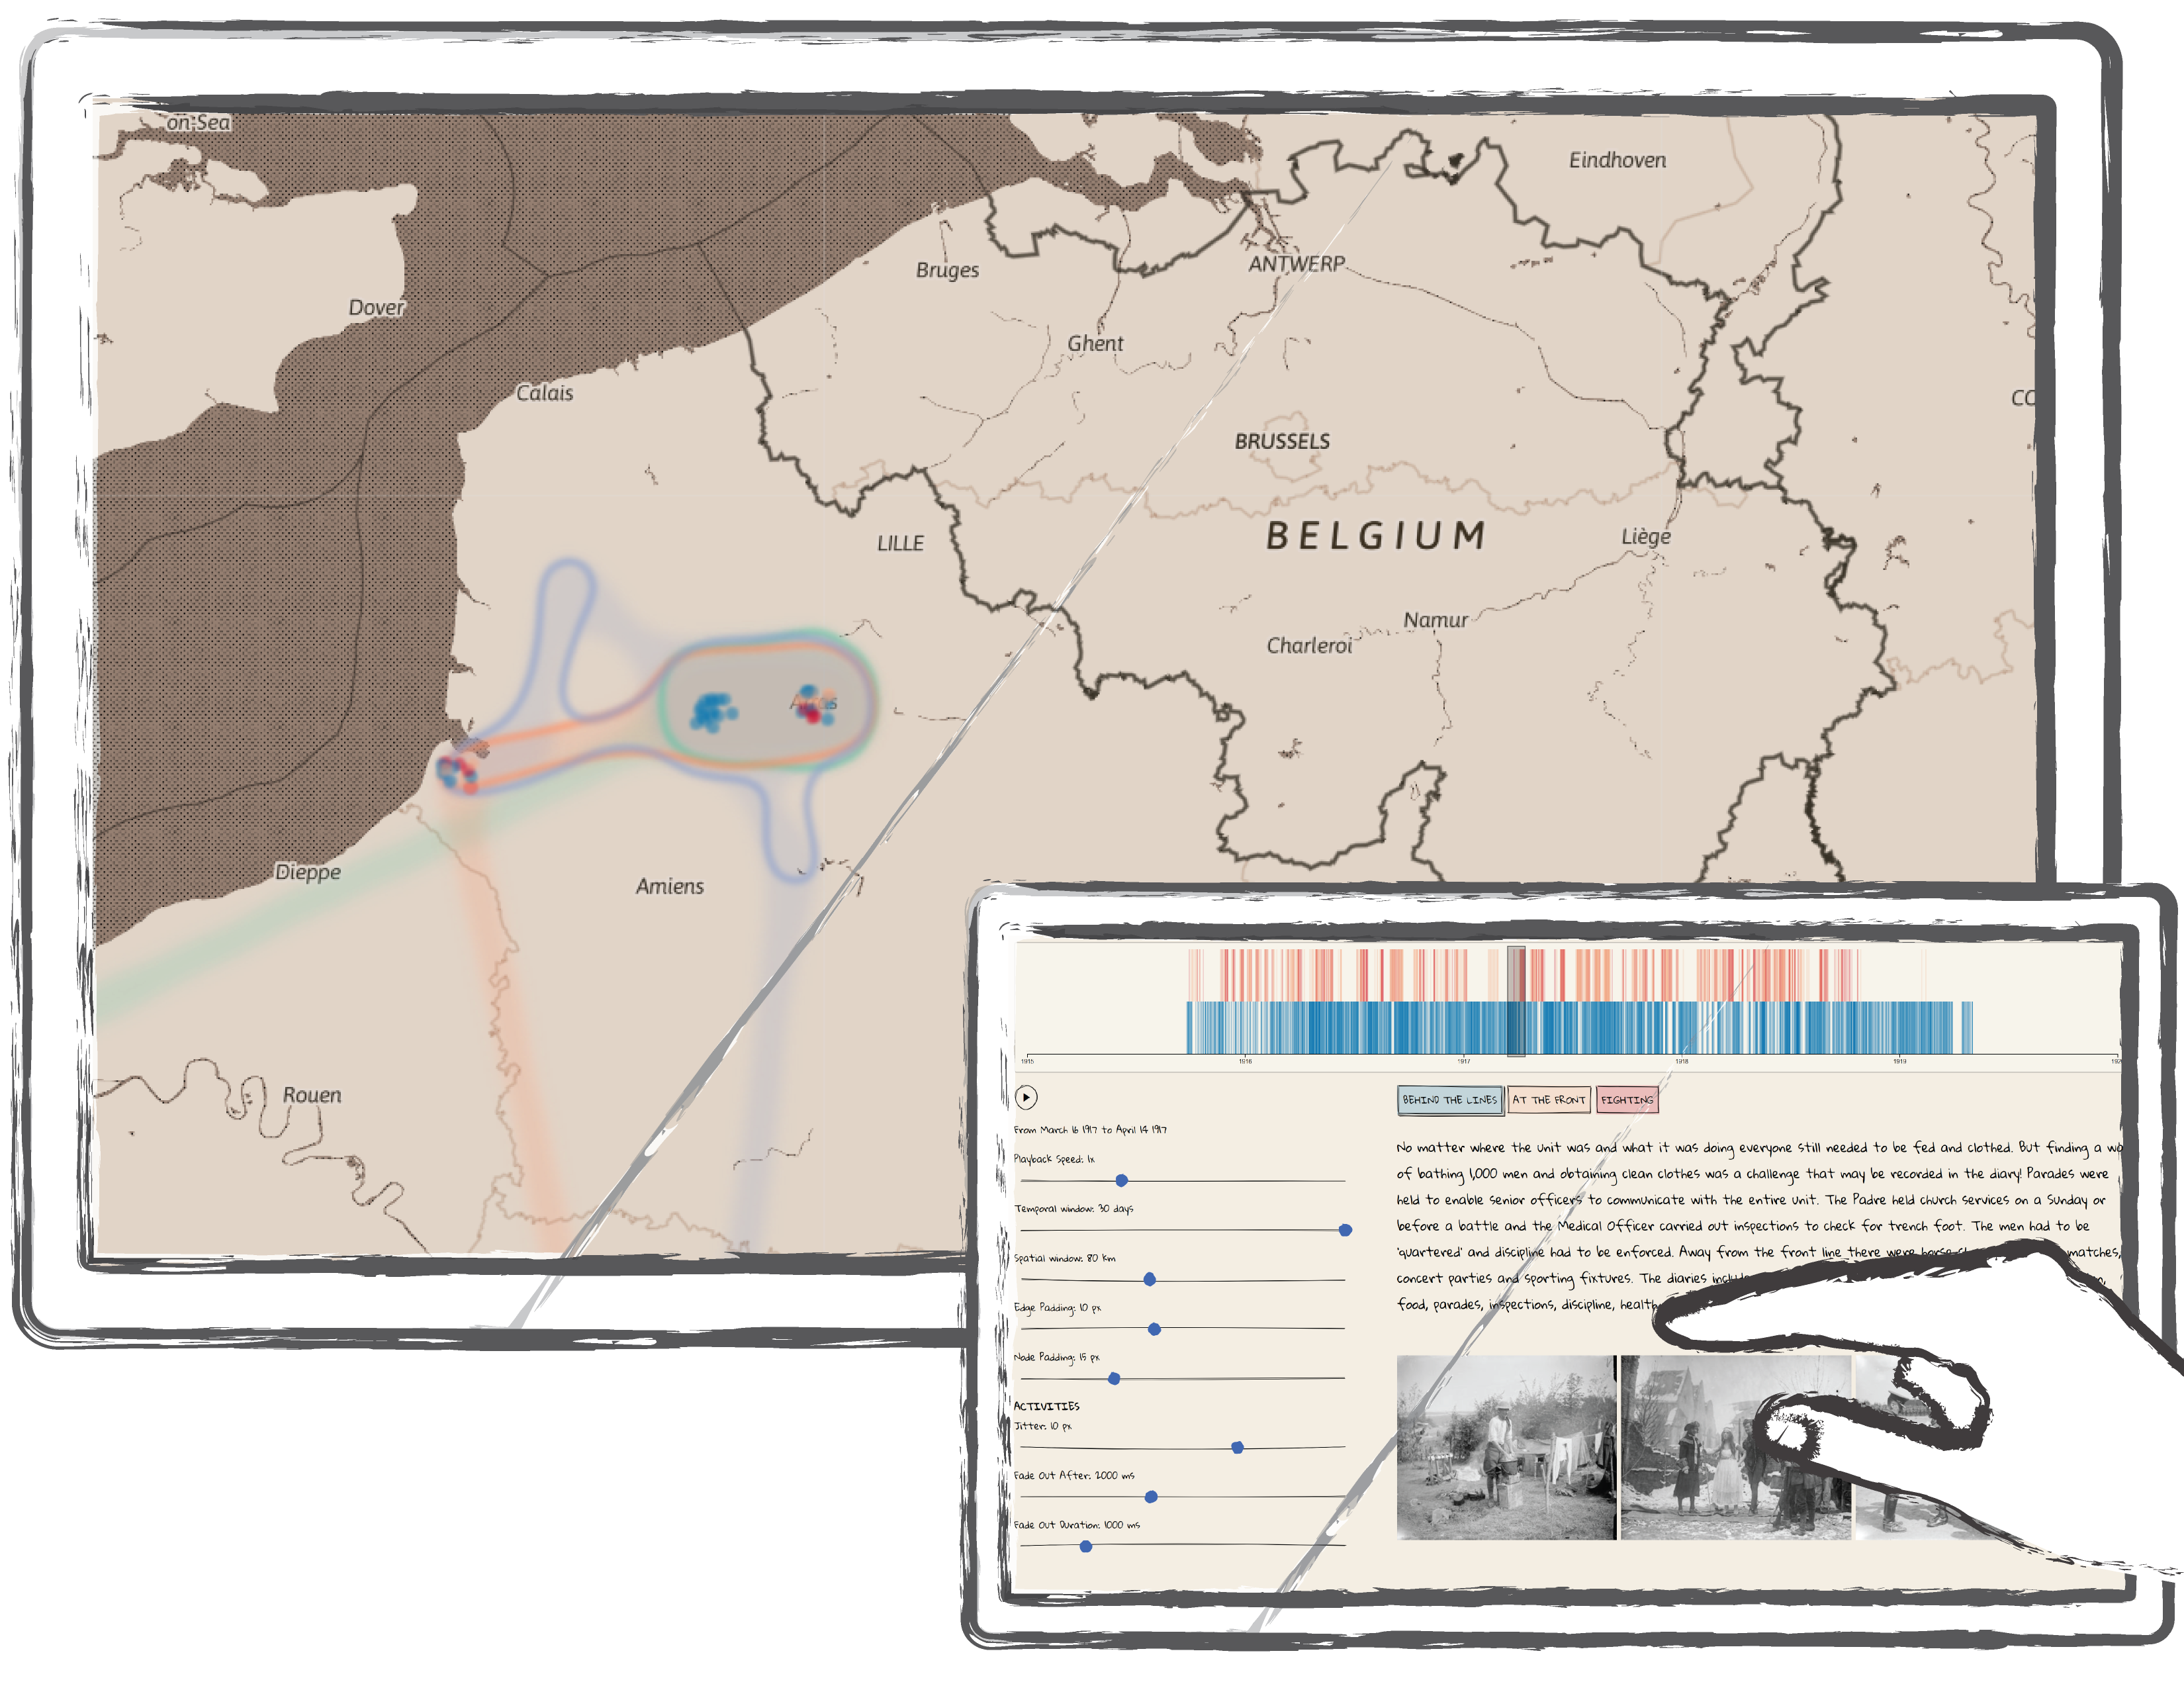
To design visual representations of military units that incorporate and acknowledge uncertainty or noise in the data, we started explored possible geometries to visualize a unit's movement during the war. Instead of showing an entity at a given point in time, GeoBlobs convey an unordered estimation of the possible locations over a temporal window using enclosed shapes. Many different parameters can influence the design of GeoBlobs. We explored the following design variations in the context of the OWD data.
Temporal and Spatial Windows

Shape / Form
Stroke and Fill
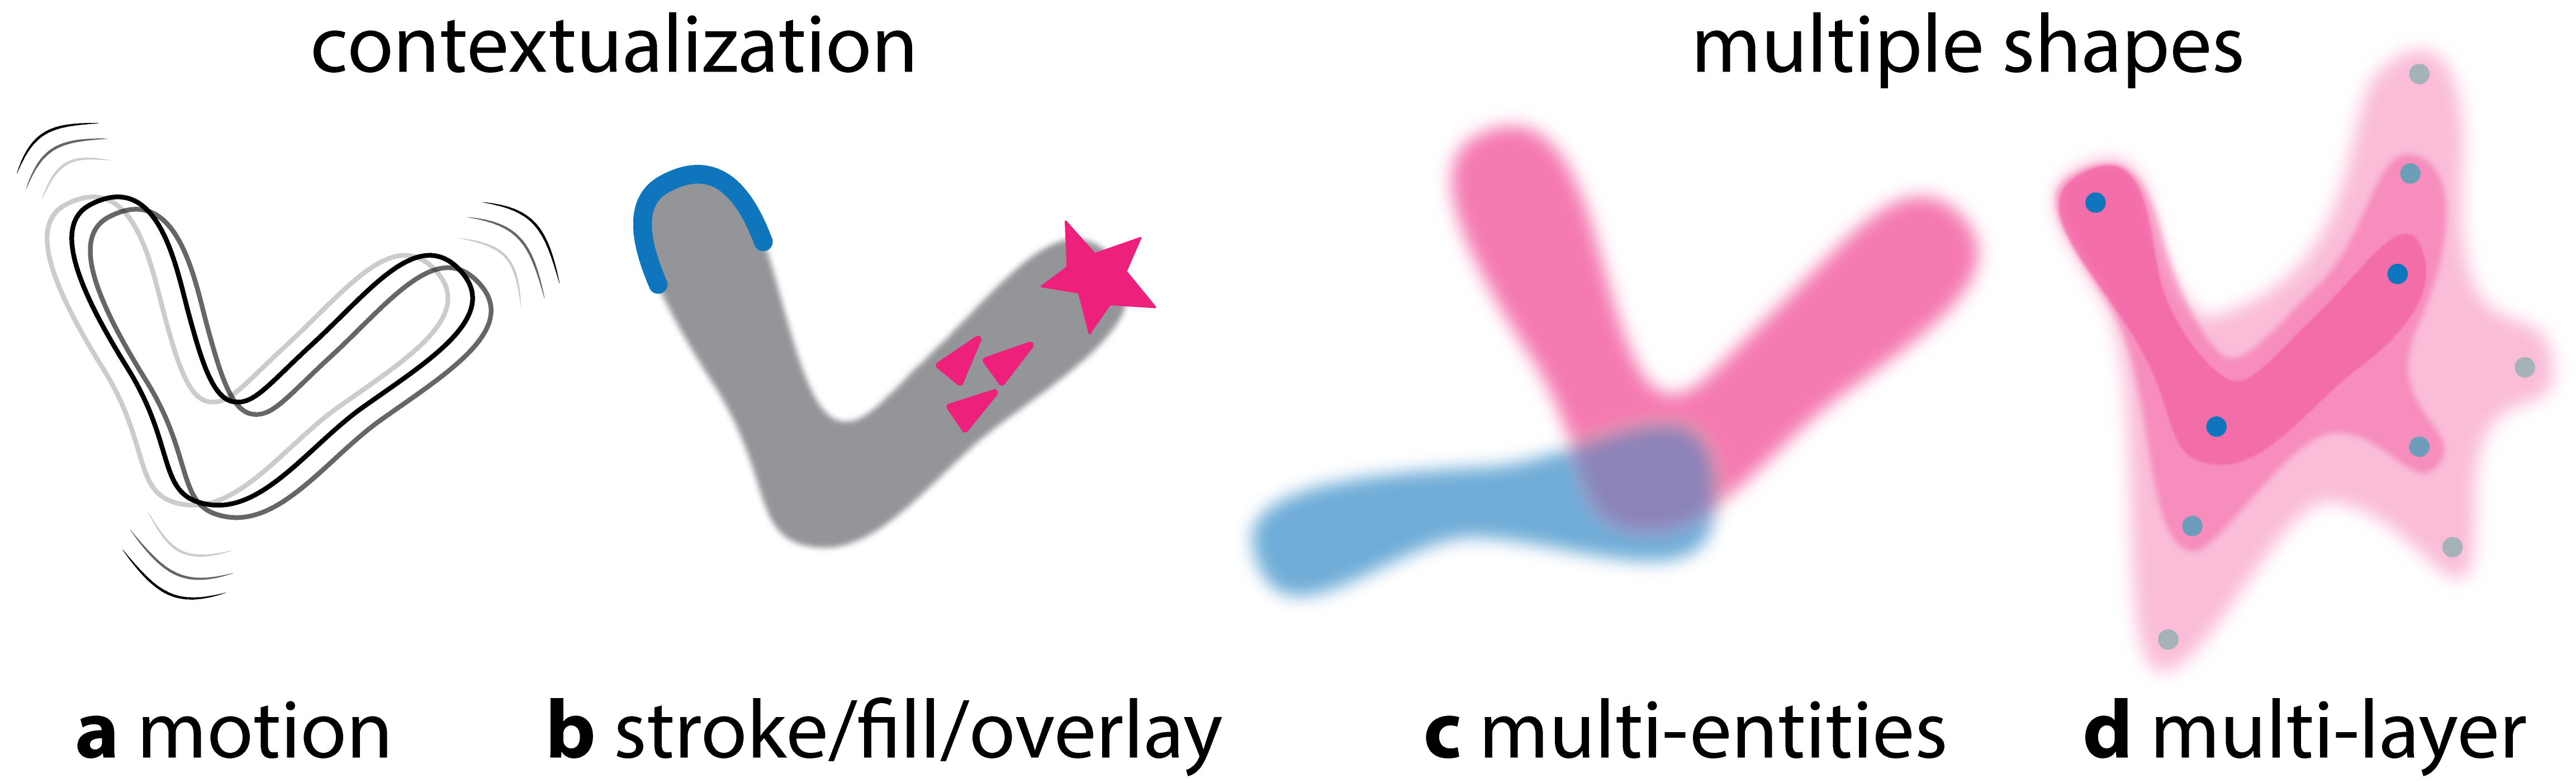
Contextualization / Symbolization
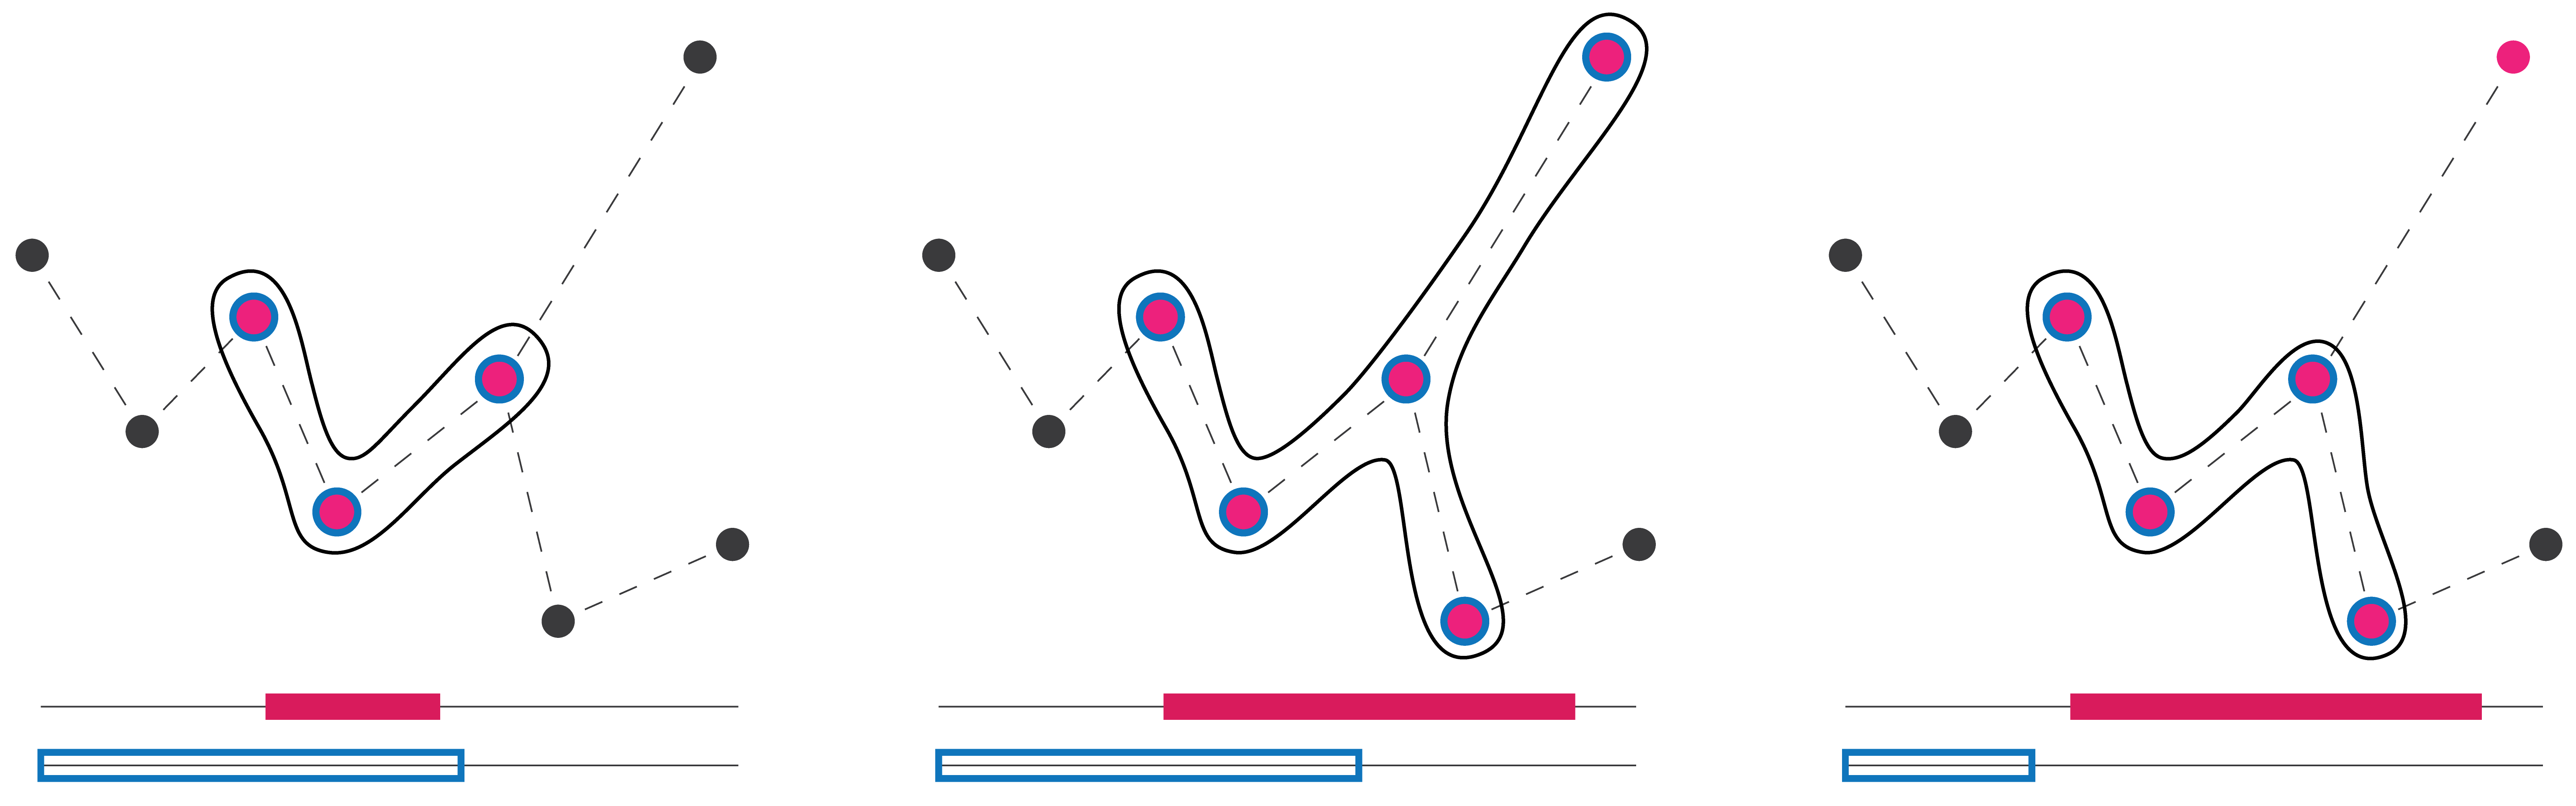
Temporal Window: a start and end date define a window for temporal aggregation of the included locations. Sliding the window on the temporal axis animates the GeoBlob over time.
Spatial Window: we apply a distance heuristics to weight each location within the temporal window and adjust the set of locations that form the GeoBlob. This helps to filter outliers (e.g., unlikely locations that have an incorrect geo-location)
Shape: we distinguish convex-hull-like, skeleton like, and graph-like shapes. While skeleton-like geometries connect locations along the shortest distance, graph-like GeoBlobs consider the temporal order of locations. Buffers for nodes and edges can influence the appearance of a GeoBlob; we distinguish between wide, narrow and mixed buffers.
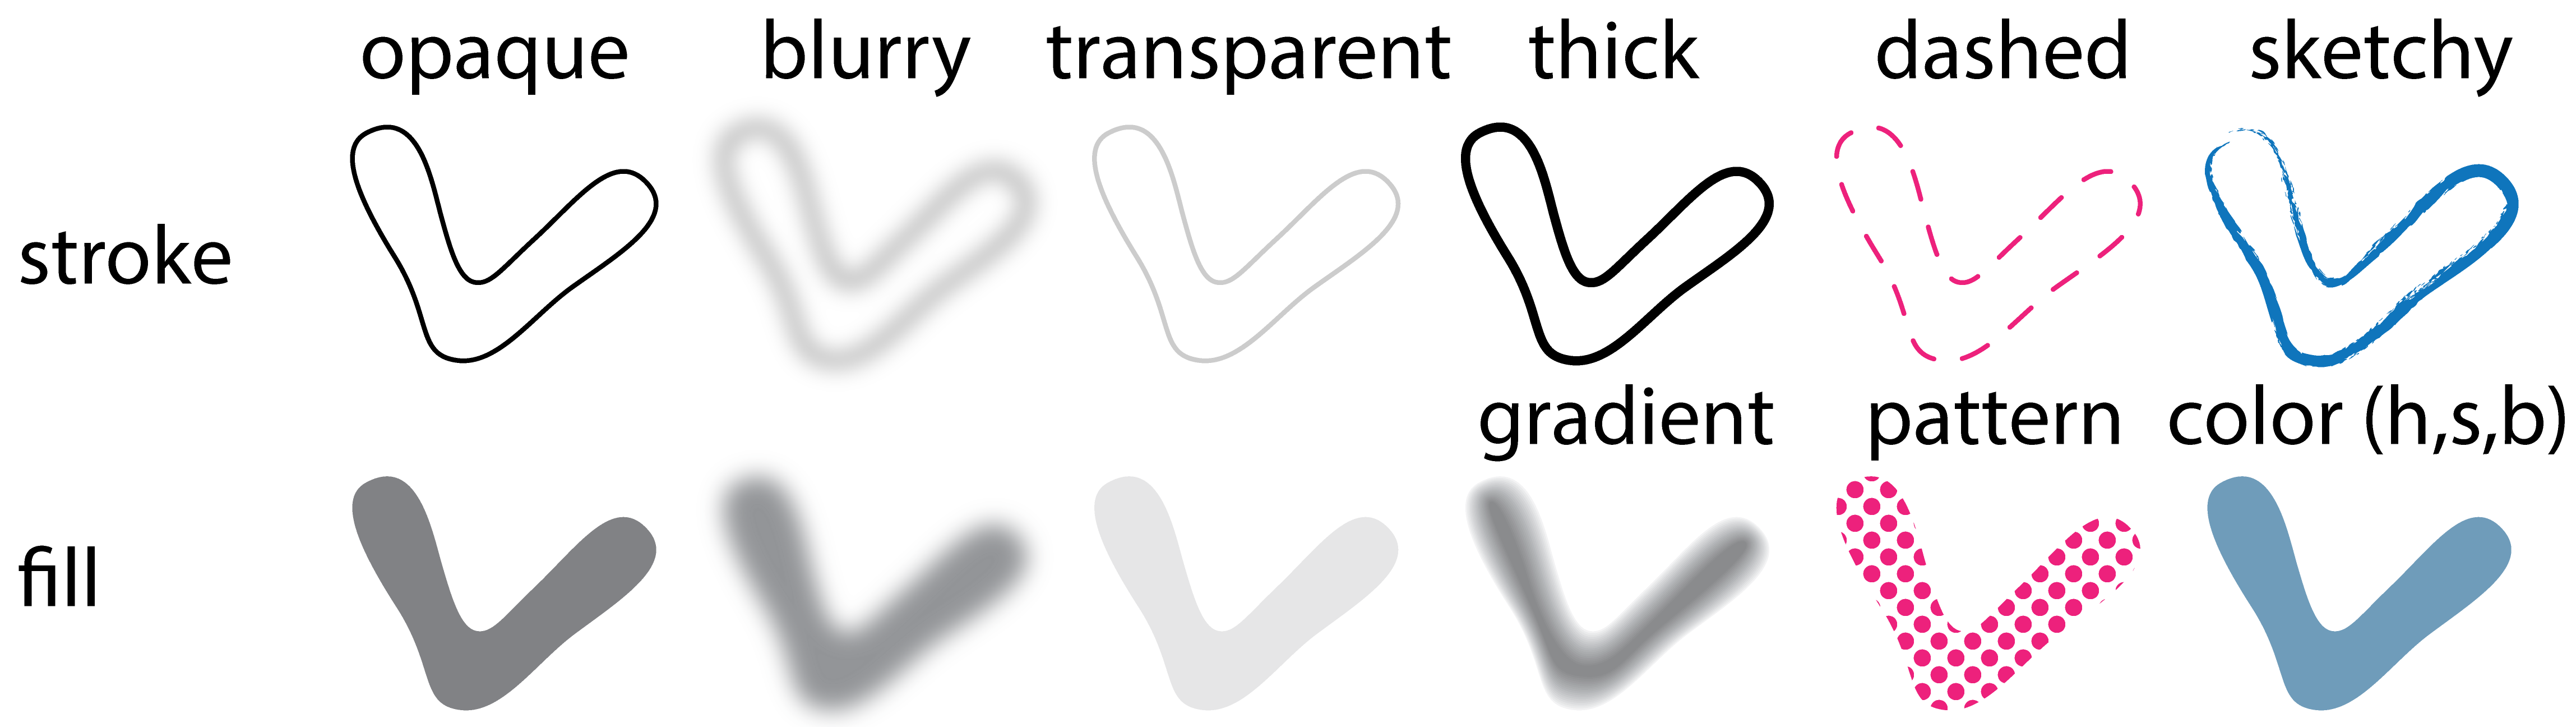
Stroke and Fill: different visual variables, including color, transparency, focus (blur effect), pattern, or gradient fill can be used to vary the visual style of a GeoBlob's stroke or fill. Especially using a blurry or sketchy style can help to visually convey the uncertainty of the data.
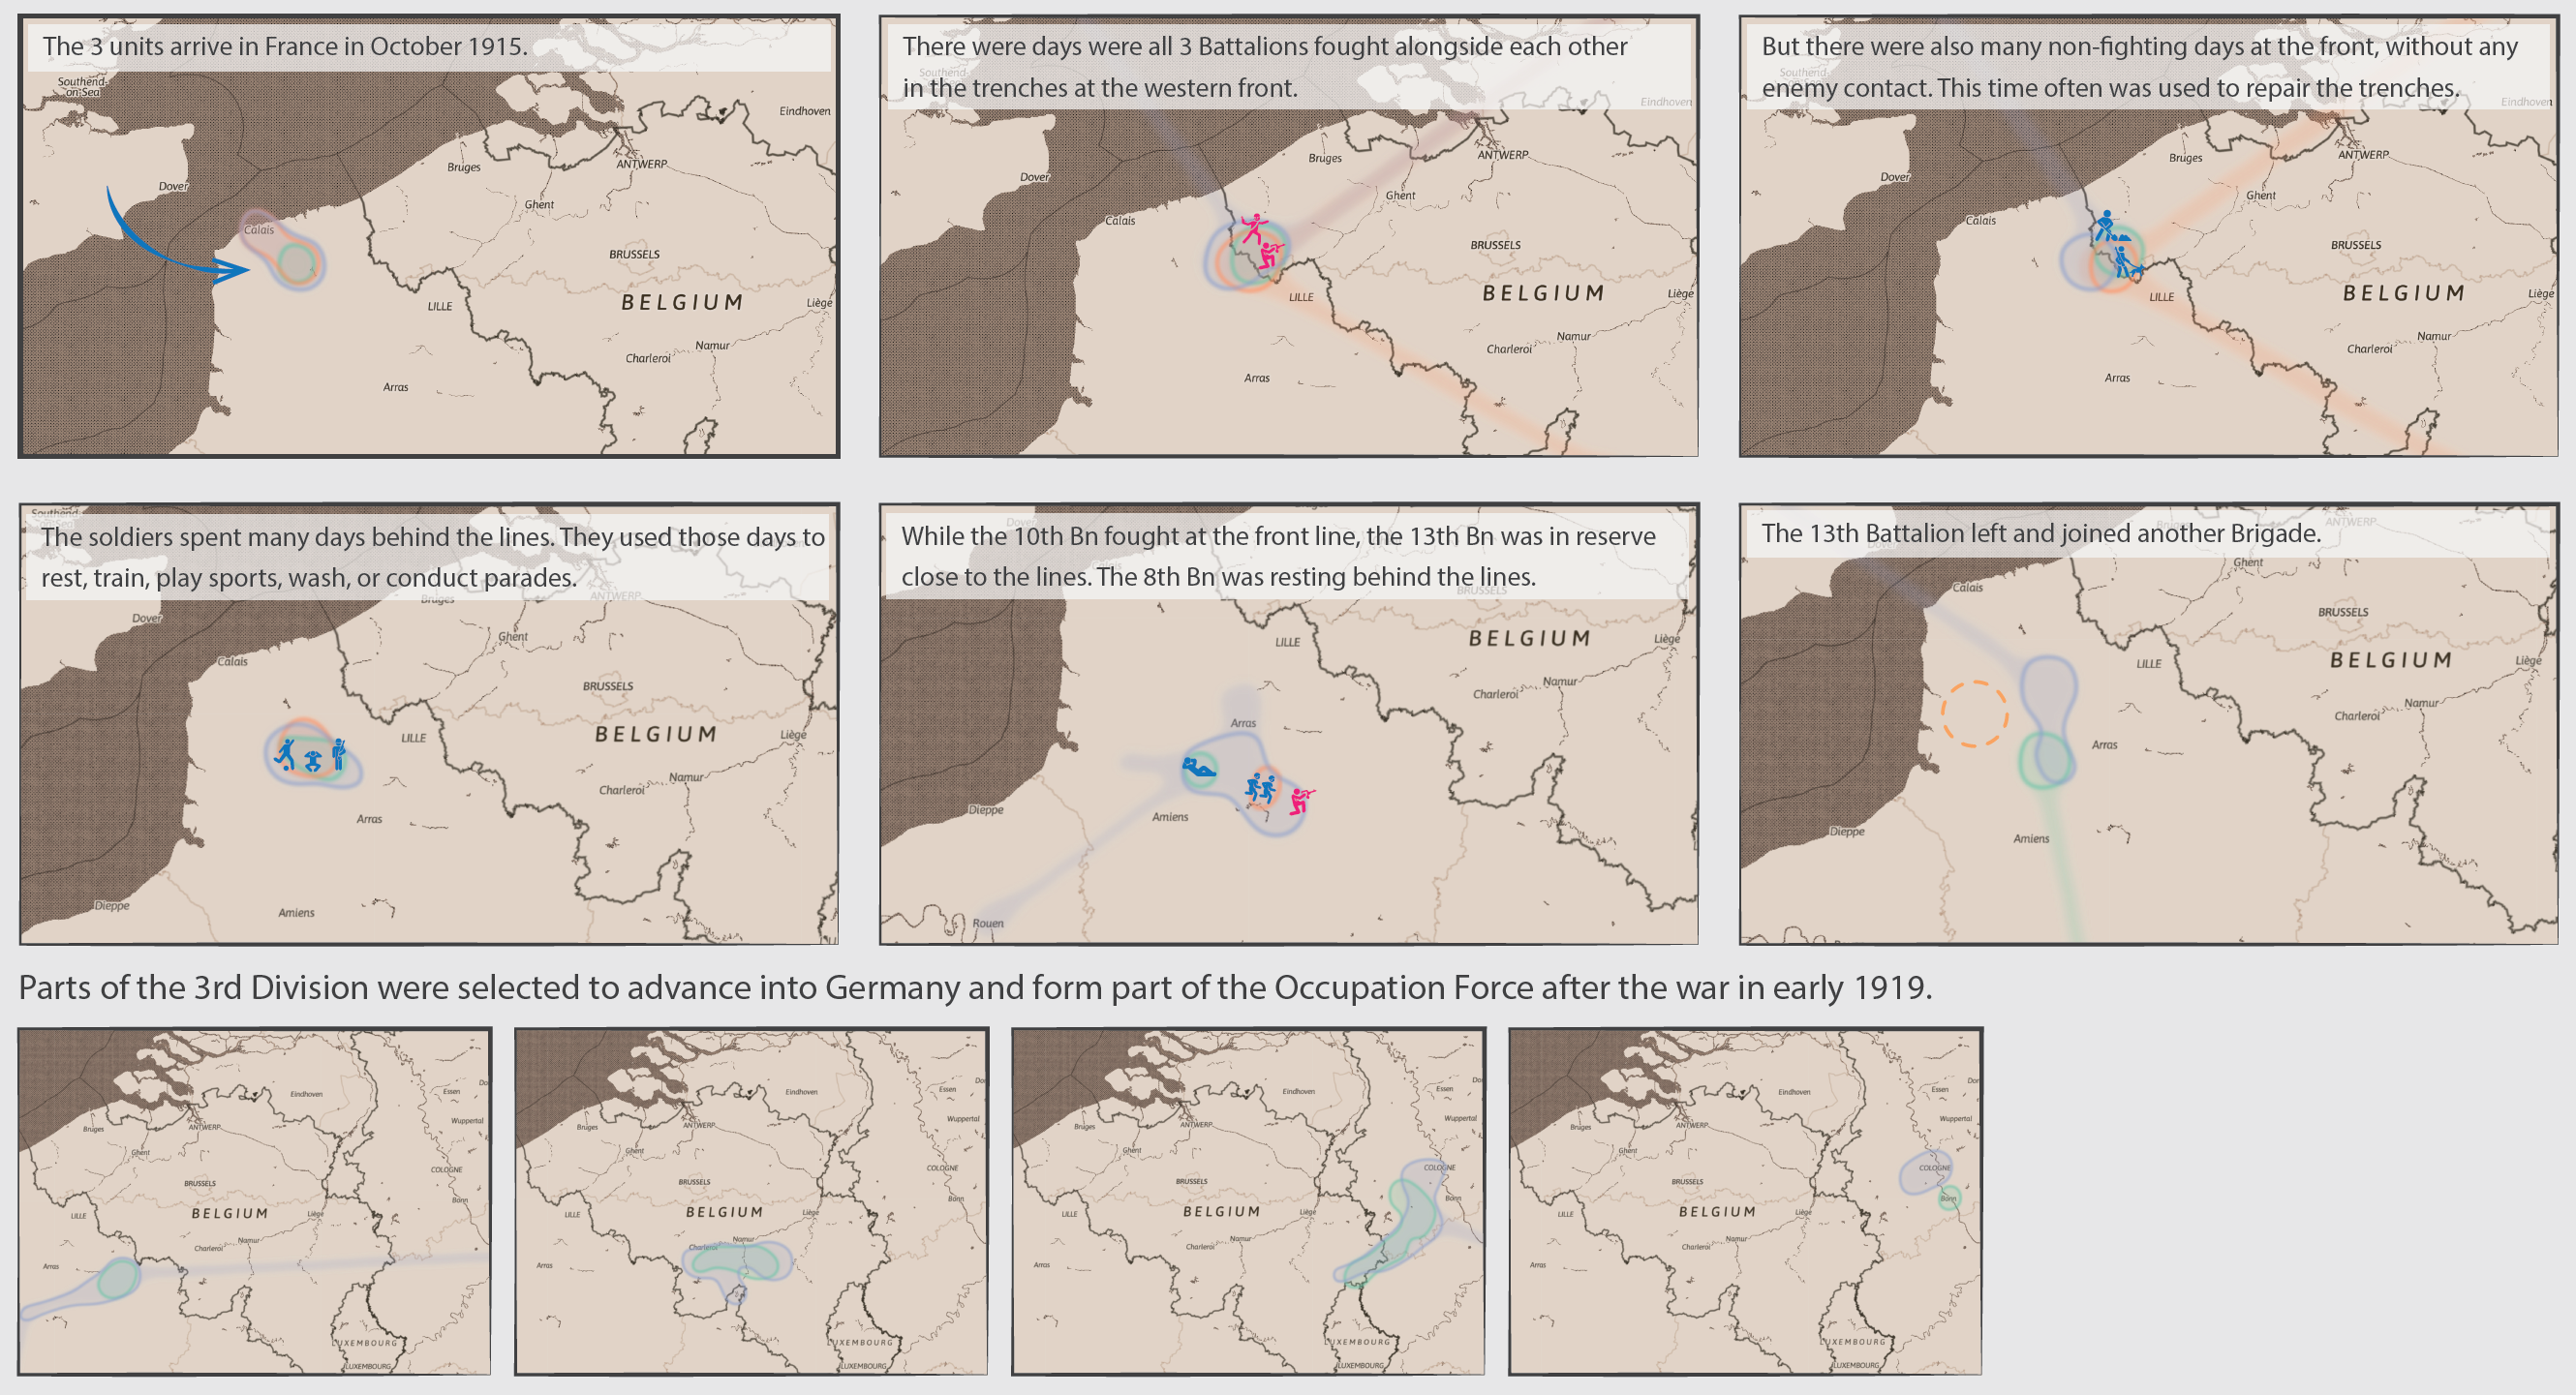
Motion: when animating a GeoBlob, its motion encodes the overall direction of the displayed army unit. Here the temporal and spatial window might introduce a certain generalization level (e.g. back and forth movements within a larger temporal window are not obvious), which on the other hand reflects the uncertainty in the data. We also investigate how motion can be applied to convey additional information like a shaking GeoBlob on fighting days.
Contextualization: besides motion, outline and fill overlays can provide context. For example by visually integrating unit activities like fighting, re-supplying the front, and resting behind the lines or events like famous battles.
Multiple Shapes: mapping multiple entities (i.e., army units) concurrently allows to compare their individual movements (e.g., two units were located at the same front, but split after a battle). Generating multiple layers for a single GeoBlob taking the different location probabilities into account and using transparency allows to convey the uncertainty of the locations."
Geoblobs in the World War One Hundred Project
Experts have collected historical information in analog forms throughout history. Today, modern technology, such as applications, devices or sensors, change the ways of collecting massive amounts of historical data entirely. Modern techniques now allow us to transform such analog information into digital data, making more and more data available in the Digital Humanities. In the case of OWD data, the digitized and qualified hand-written diaries (OWD data) provide an interface to otherwise buried information. This data is an unprecedented source of information that makes it possible to look at WWI through the lens of well-structured and rather exhaustive war diaries, thus provide new historical perspectives we can perhaps better relate to on a personal level. History, or past events in general, influences our cultural identity in manifold ways.
Both World Wars greatly influenced how we live together in Europe, shaping our collective as well as our personal identities. This piece is not intended to communicate battles, victories or defeats of WWI only. Instead, it aims at communicating a sense of the day-to-day life in the war zone. Communicating the OWD data as a whole, including fighting and non-fighting activities, we aim at bringing to light aspects of war that can contribute to the better understanding of Europe's collective past. In the light of the current political climate, we think that it is important to highlight our collective memory, rather than a silo national mentality, that may help young generations to understand current developments.
Project Publications
-
 Visualising the Uncertain in Heritage Collections: Understanding, Exploring and Representing Uncertainty in the First World War British Unit War Diaries Literary Geographies. 2023.

-
 WWI00 {World War One Hundred} IEEE VIS 2018 Arts Program demonstrations, Berlin, Germany. IEEE. 2018.
-
 Conveying Uncertainty in Archived War Diaries with GeoBlobs IEEE VIS 2018 Electronic Conference Proceedings, Berlin, Germany. IEEE. 2018.