Open Data Visualization with the NEB
We have been working with the National Energy Board of Canada towards improving the role of visualization for citizens, energy stakeholders and decision-makers to explore and make sense of open data.
Innovation award for energy futures visualizations
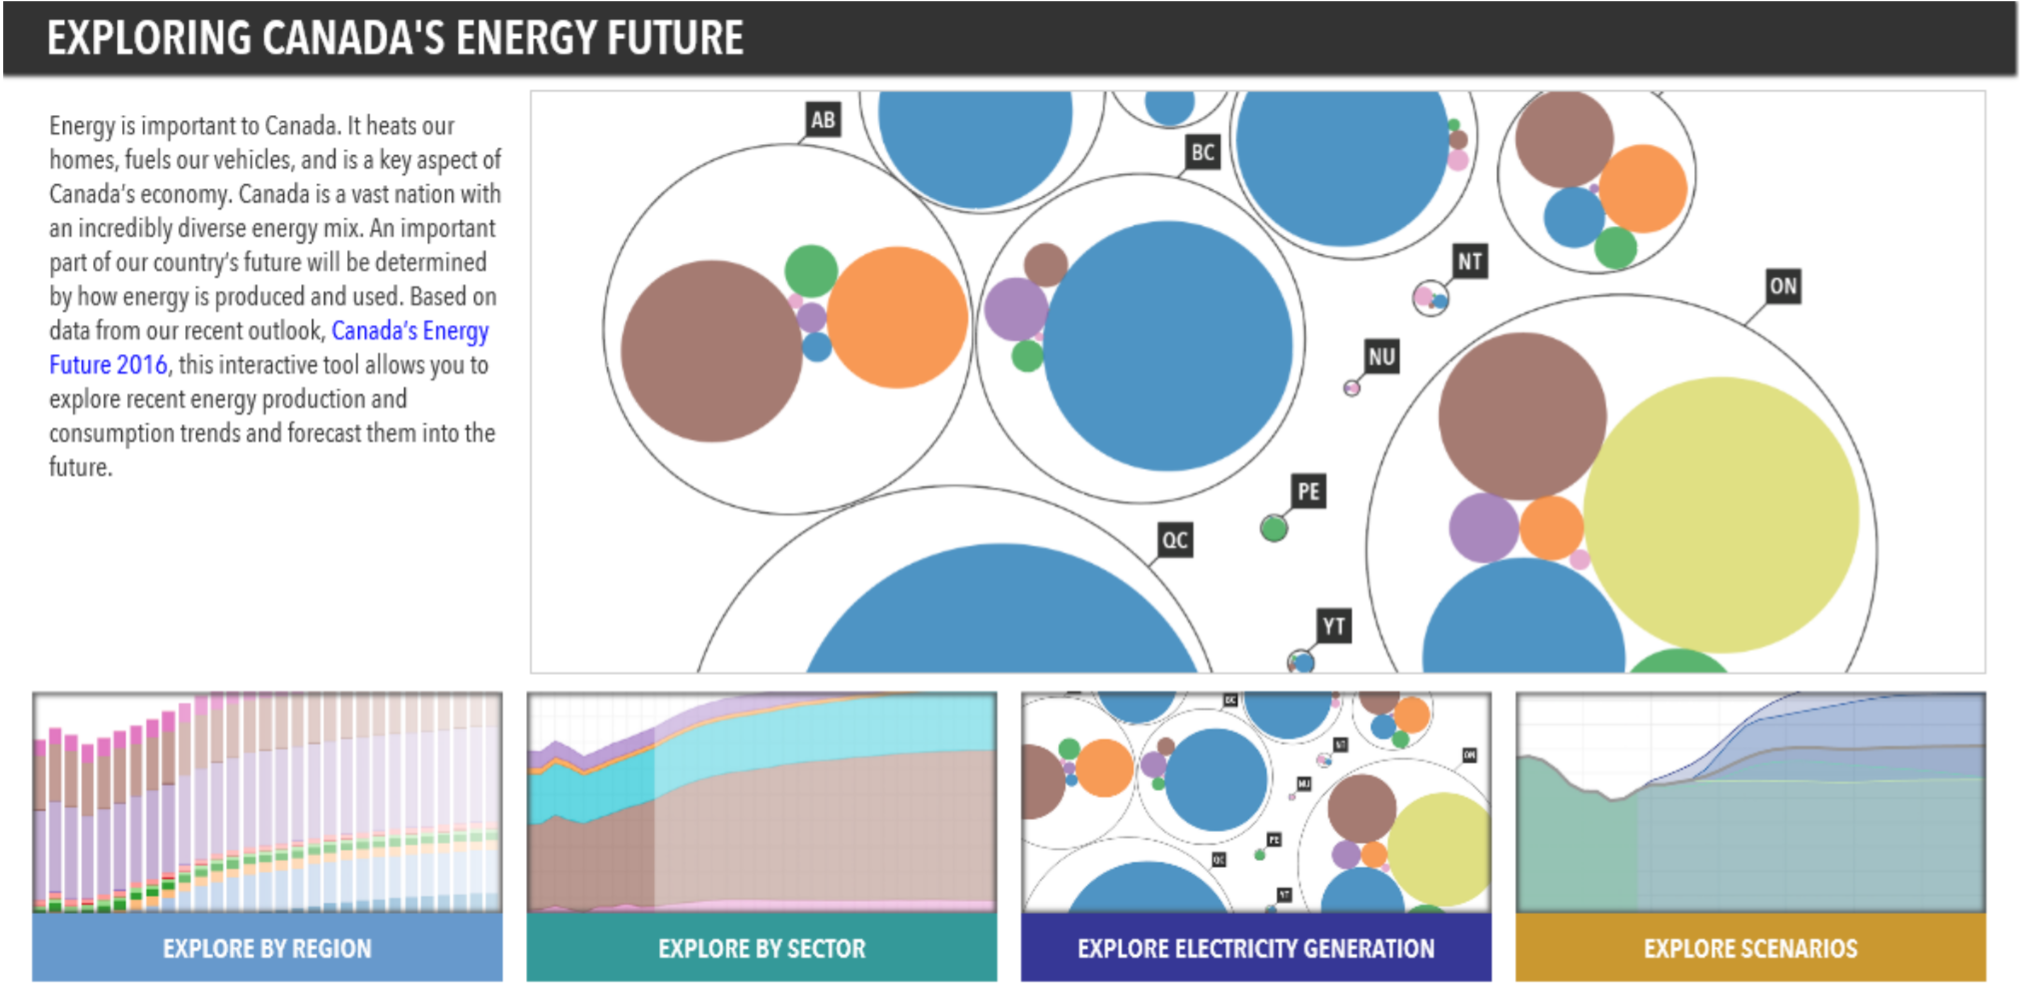
In December 2016 the National Energy Board of Canada (NEB) was awarded a Regulatory Excellence Award in the category 'Contribution to Innovation in the Regulatory Field' for the Energy Futures visualizations. I was leading the design team at the University of Calgary that designed these interactive visualizations to make the NEB's Energy Futures data accessible to the general public. The award was granted to the NEB by the Community of Federal Regulators at the Regulatory Excellence Awards ceremony in Ottawa.
Understanding how people discover interactive functionality
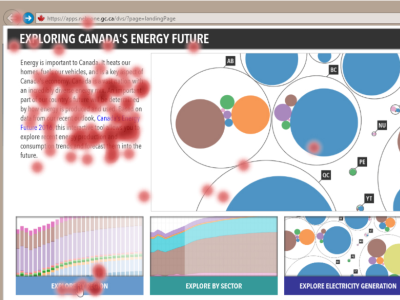
We used the interactive visualizations we designed to investigate the discovery of the functionality of an interactive visualization designed for the general public. While interactive visualizations are increasingly available for public use, we still know little about how the general public investigates and discovers what they can do with these visualizations. Understanding the discovery process allows to develop better interfaces for the general public and make data more accessible to them. To unpack this problem, we analyzed the results of a lab study where participants discovered the functionality of a connected set of visualizations of public energy data. We collected eye tracking data and interaction logs, as well as video and audio recordings. By integrating this quantitative and qualitative data, we extracted five exploration strategies employed by participants to discover the functionality in these interactive visualizations. These exploration strategies illuminate possible design directions for future interactive visualizations.


