Interactive Horizon Graphs
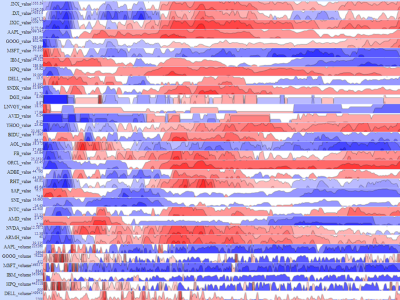
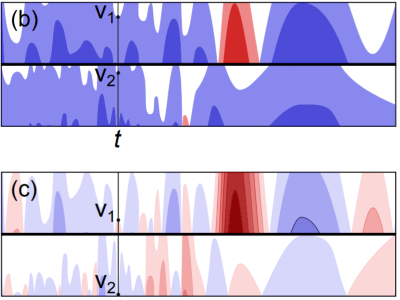
Many approaches have been proposed for the visualization of multiple time series. Two prominent approaches are reduced line charts (RLC), which display small multiples for time series, and the more recent horizon graphs (HG). We propose to unify RLC and HG using a new technique—interactive horizon graphs (IHG)— which uses pan and zoom interaction to increase the number of time series that can be analysed in parallel. In a user study we compared RLC, HG, and IHG across several tasks and numbers of time series, focusing on datasets with both large scale and small scale variations. Our results show that IHG outperform the other two techniques in complex comparison and matching tasks where the number of charts is large. In the hardest task IHG have a significantly higher number of good answers (correctness) than HG (+14%) and RLC (+51%) and a lower error magnitude than HG (-64%) and RLC (-86%).
Try Out Interactive Horizon Graphs
Use only Chrome to be able to interact with both the Pan and the Zoom: FF is slow and does not handle the Pan, and Safari is incredibly slow.
Control the values of "Pan and Zoom":
- Zoom interaction: Drag the LEFT mousebutton on any chart. Drag up/down to increase/decrease the zoom factor.
- Pan interaction: Drag the RIGHT mousebutton on any chart. Drag up/down to increase/decrease the pan value (i.e. the value of the baseline).
Thanks to Romain Vuillemot for implementing the first version of Interactive Horizon Graphs using d3.


