Patient-Generated Data Visualizations


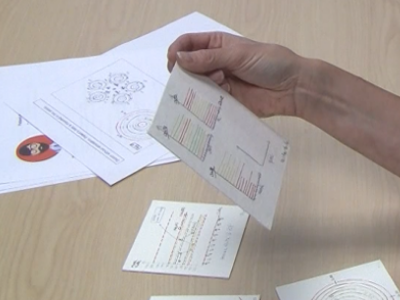
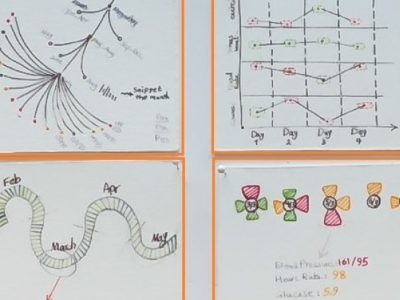
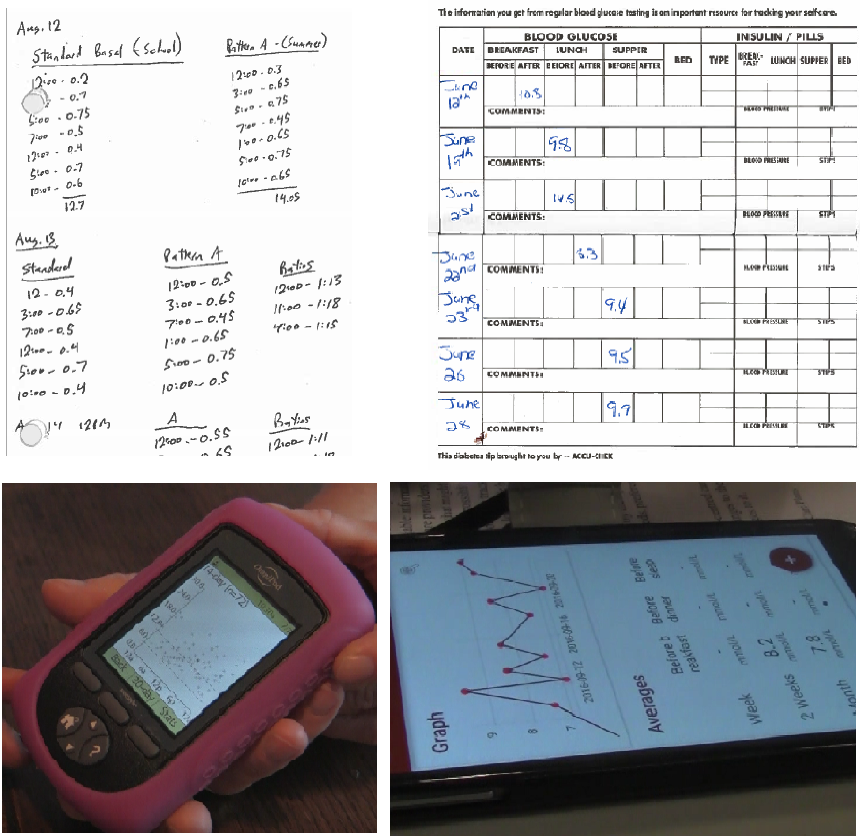
We were approached by a group of healthcare providers who are involved in the care of chronic patients looking for potential technologies to facilitate the process of reviewing patient-generated data during clinical visits. Aiming at understanding the healthcare providers' attitudes towards reviewing patient-generated data, we (1) conducted a focus group with a mixed group of healthcare providers. Next, to gain the patients' perspectives, we (2) interviewed eight chronic patients, collected a sample of their data and designed a series of visualizations representing patient data we collected. Last, we (3) sought feedback on the visualization designs from healthcare providers who requested this exploration. We found four factors shaping patient-generated data: data & context, patient's motivation, patient’s time commitment, and patient’s support circle. Informed by the results of our studies, we discussed the importance of designing patient-generated visualizations for individuals by considering both patient and healthcare provider rather than designing with the purpose of generalization and provided guidelines for designing future patient-generated data visualizations.
Project Publications
-
 Communicating Patient Health Data: A Wicked Problem IEEE Computer Graphics and Applications. Department: People in Practice. IEEE. 2021.

-
 Exploring the Design of Patient-Generated Data Visualizations Proceedings of the Graphics Interface Conference (GI 2020), Jun 2020, Toronto, ON, Canada. Canadian Information Processing Society. 2020.
-
 Personal Patient-Generated Data Visualizations for Diabetes Patients IEEE VIS 2018 Electronic Conference Proceedings, Berlin, Germany. IEEE. 2018.